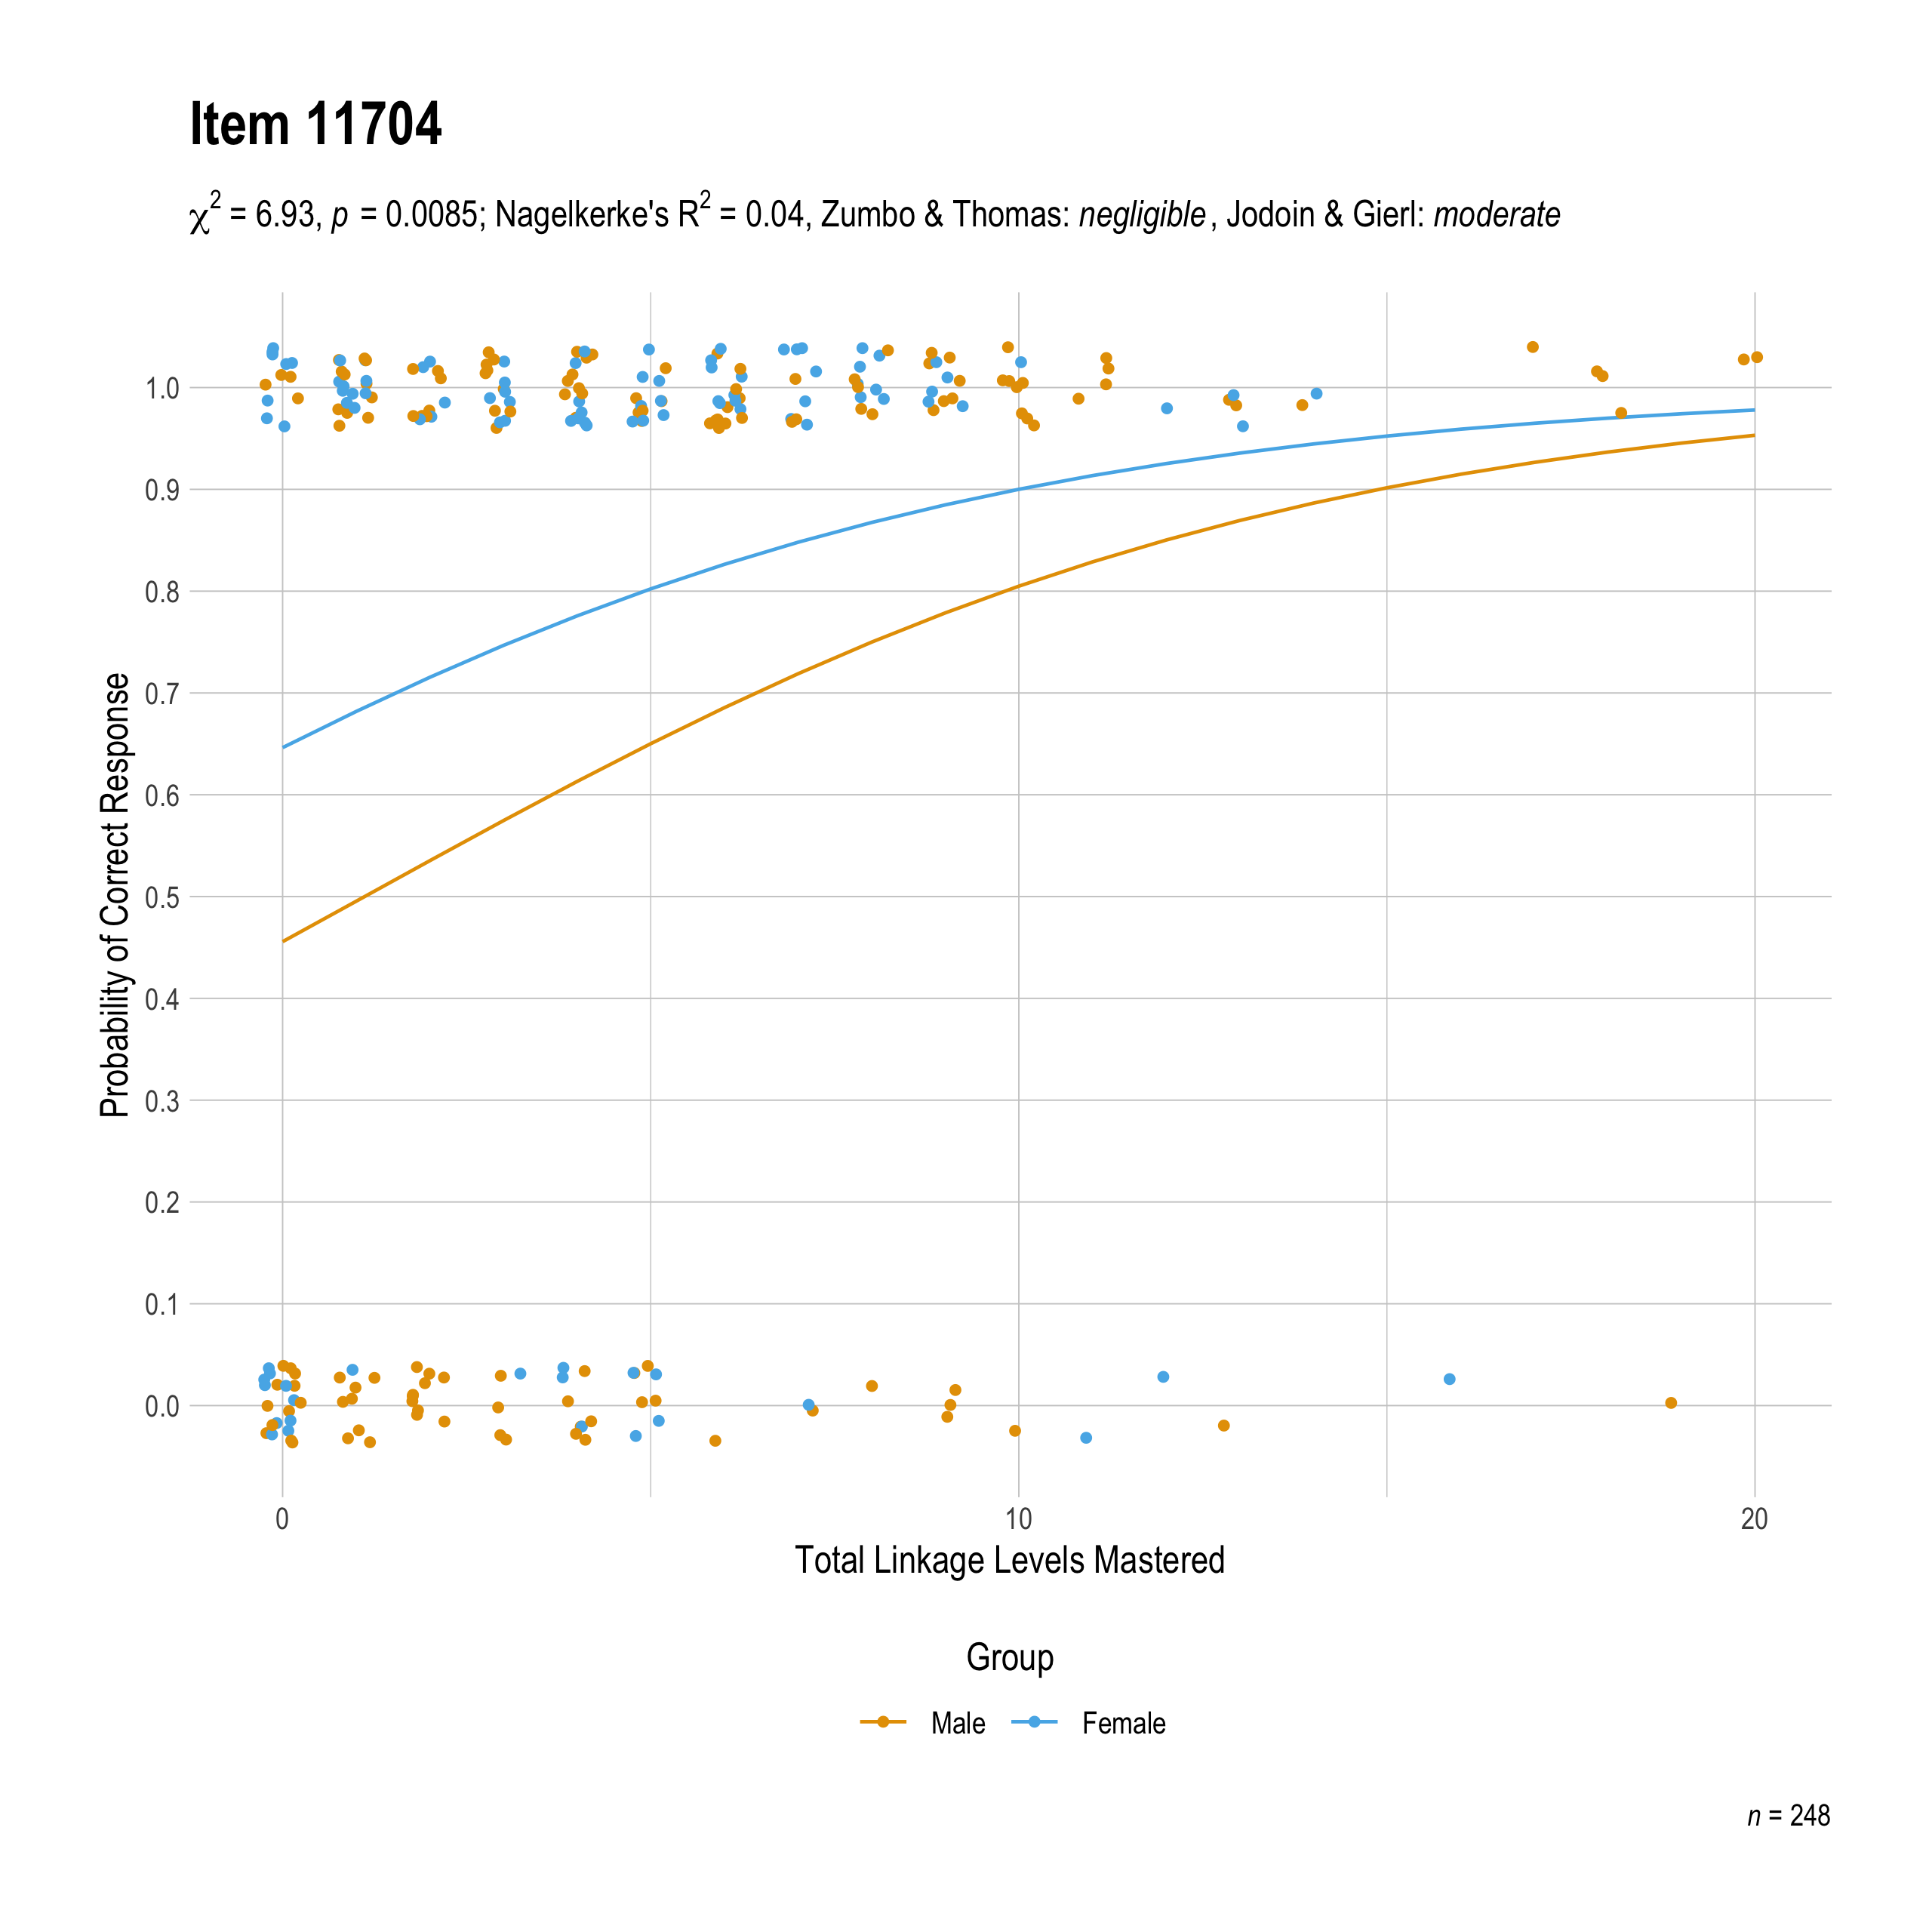
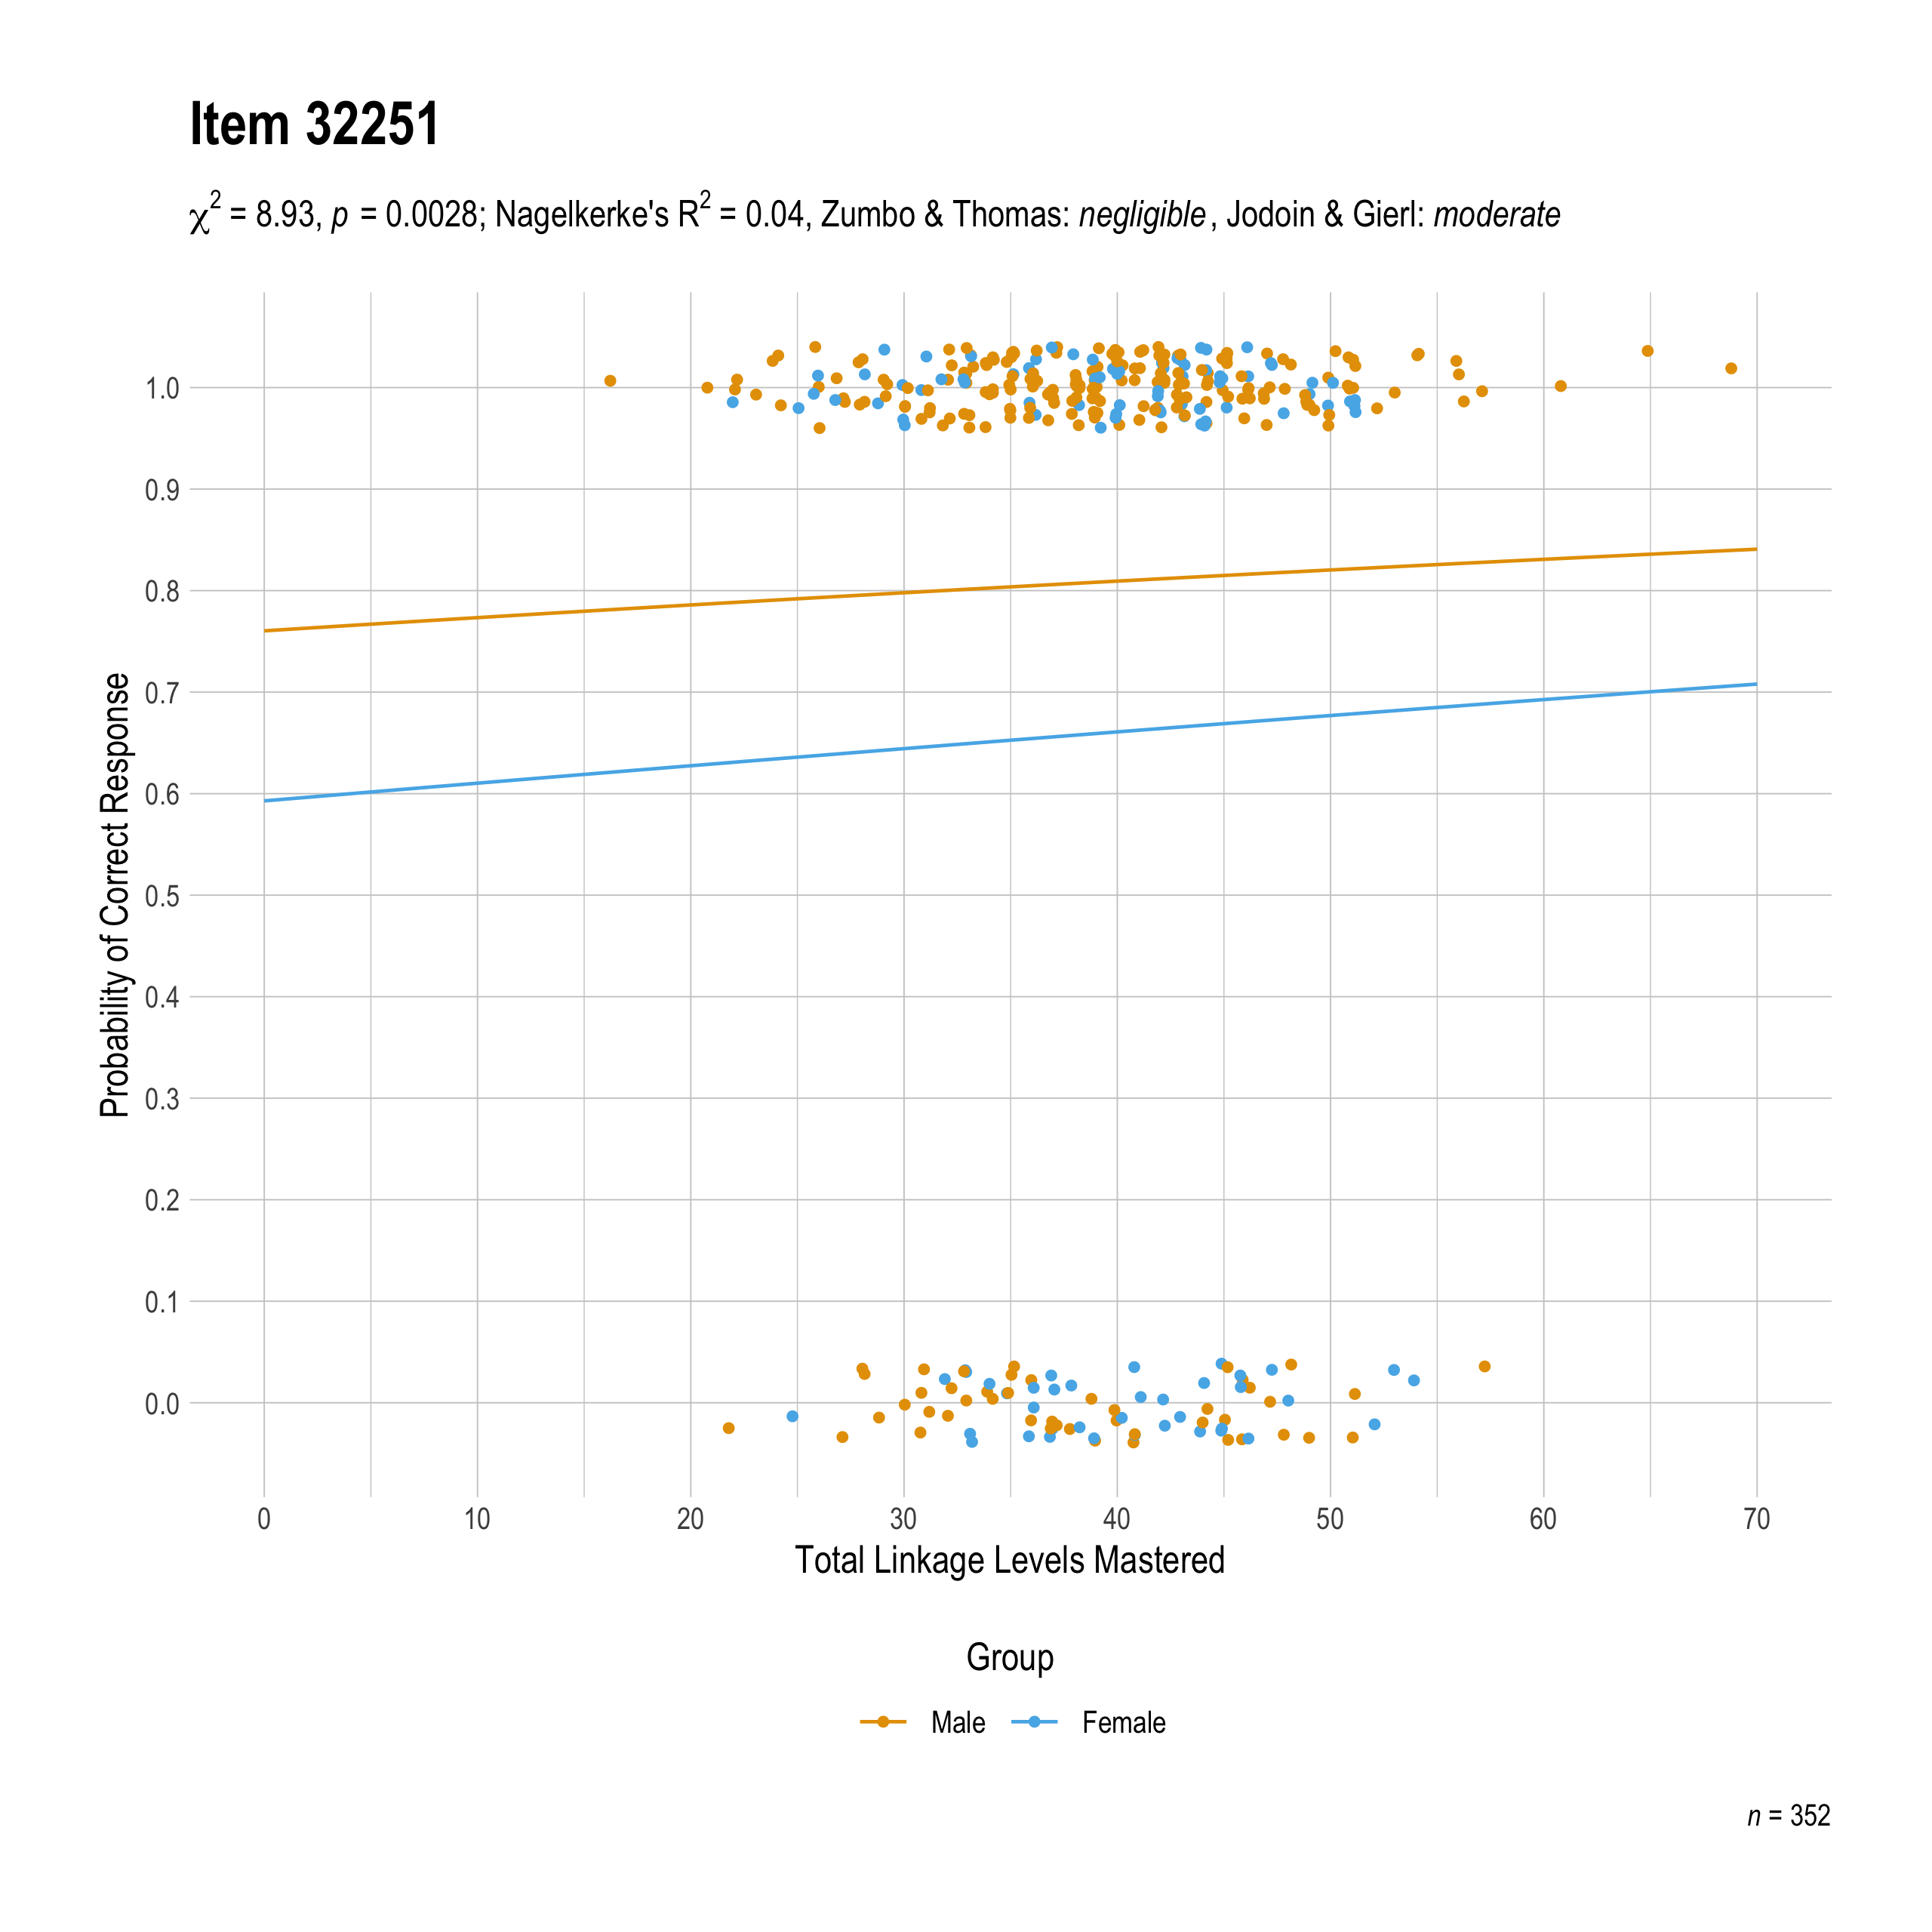
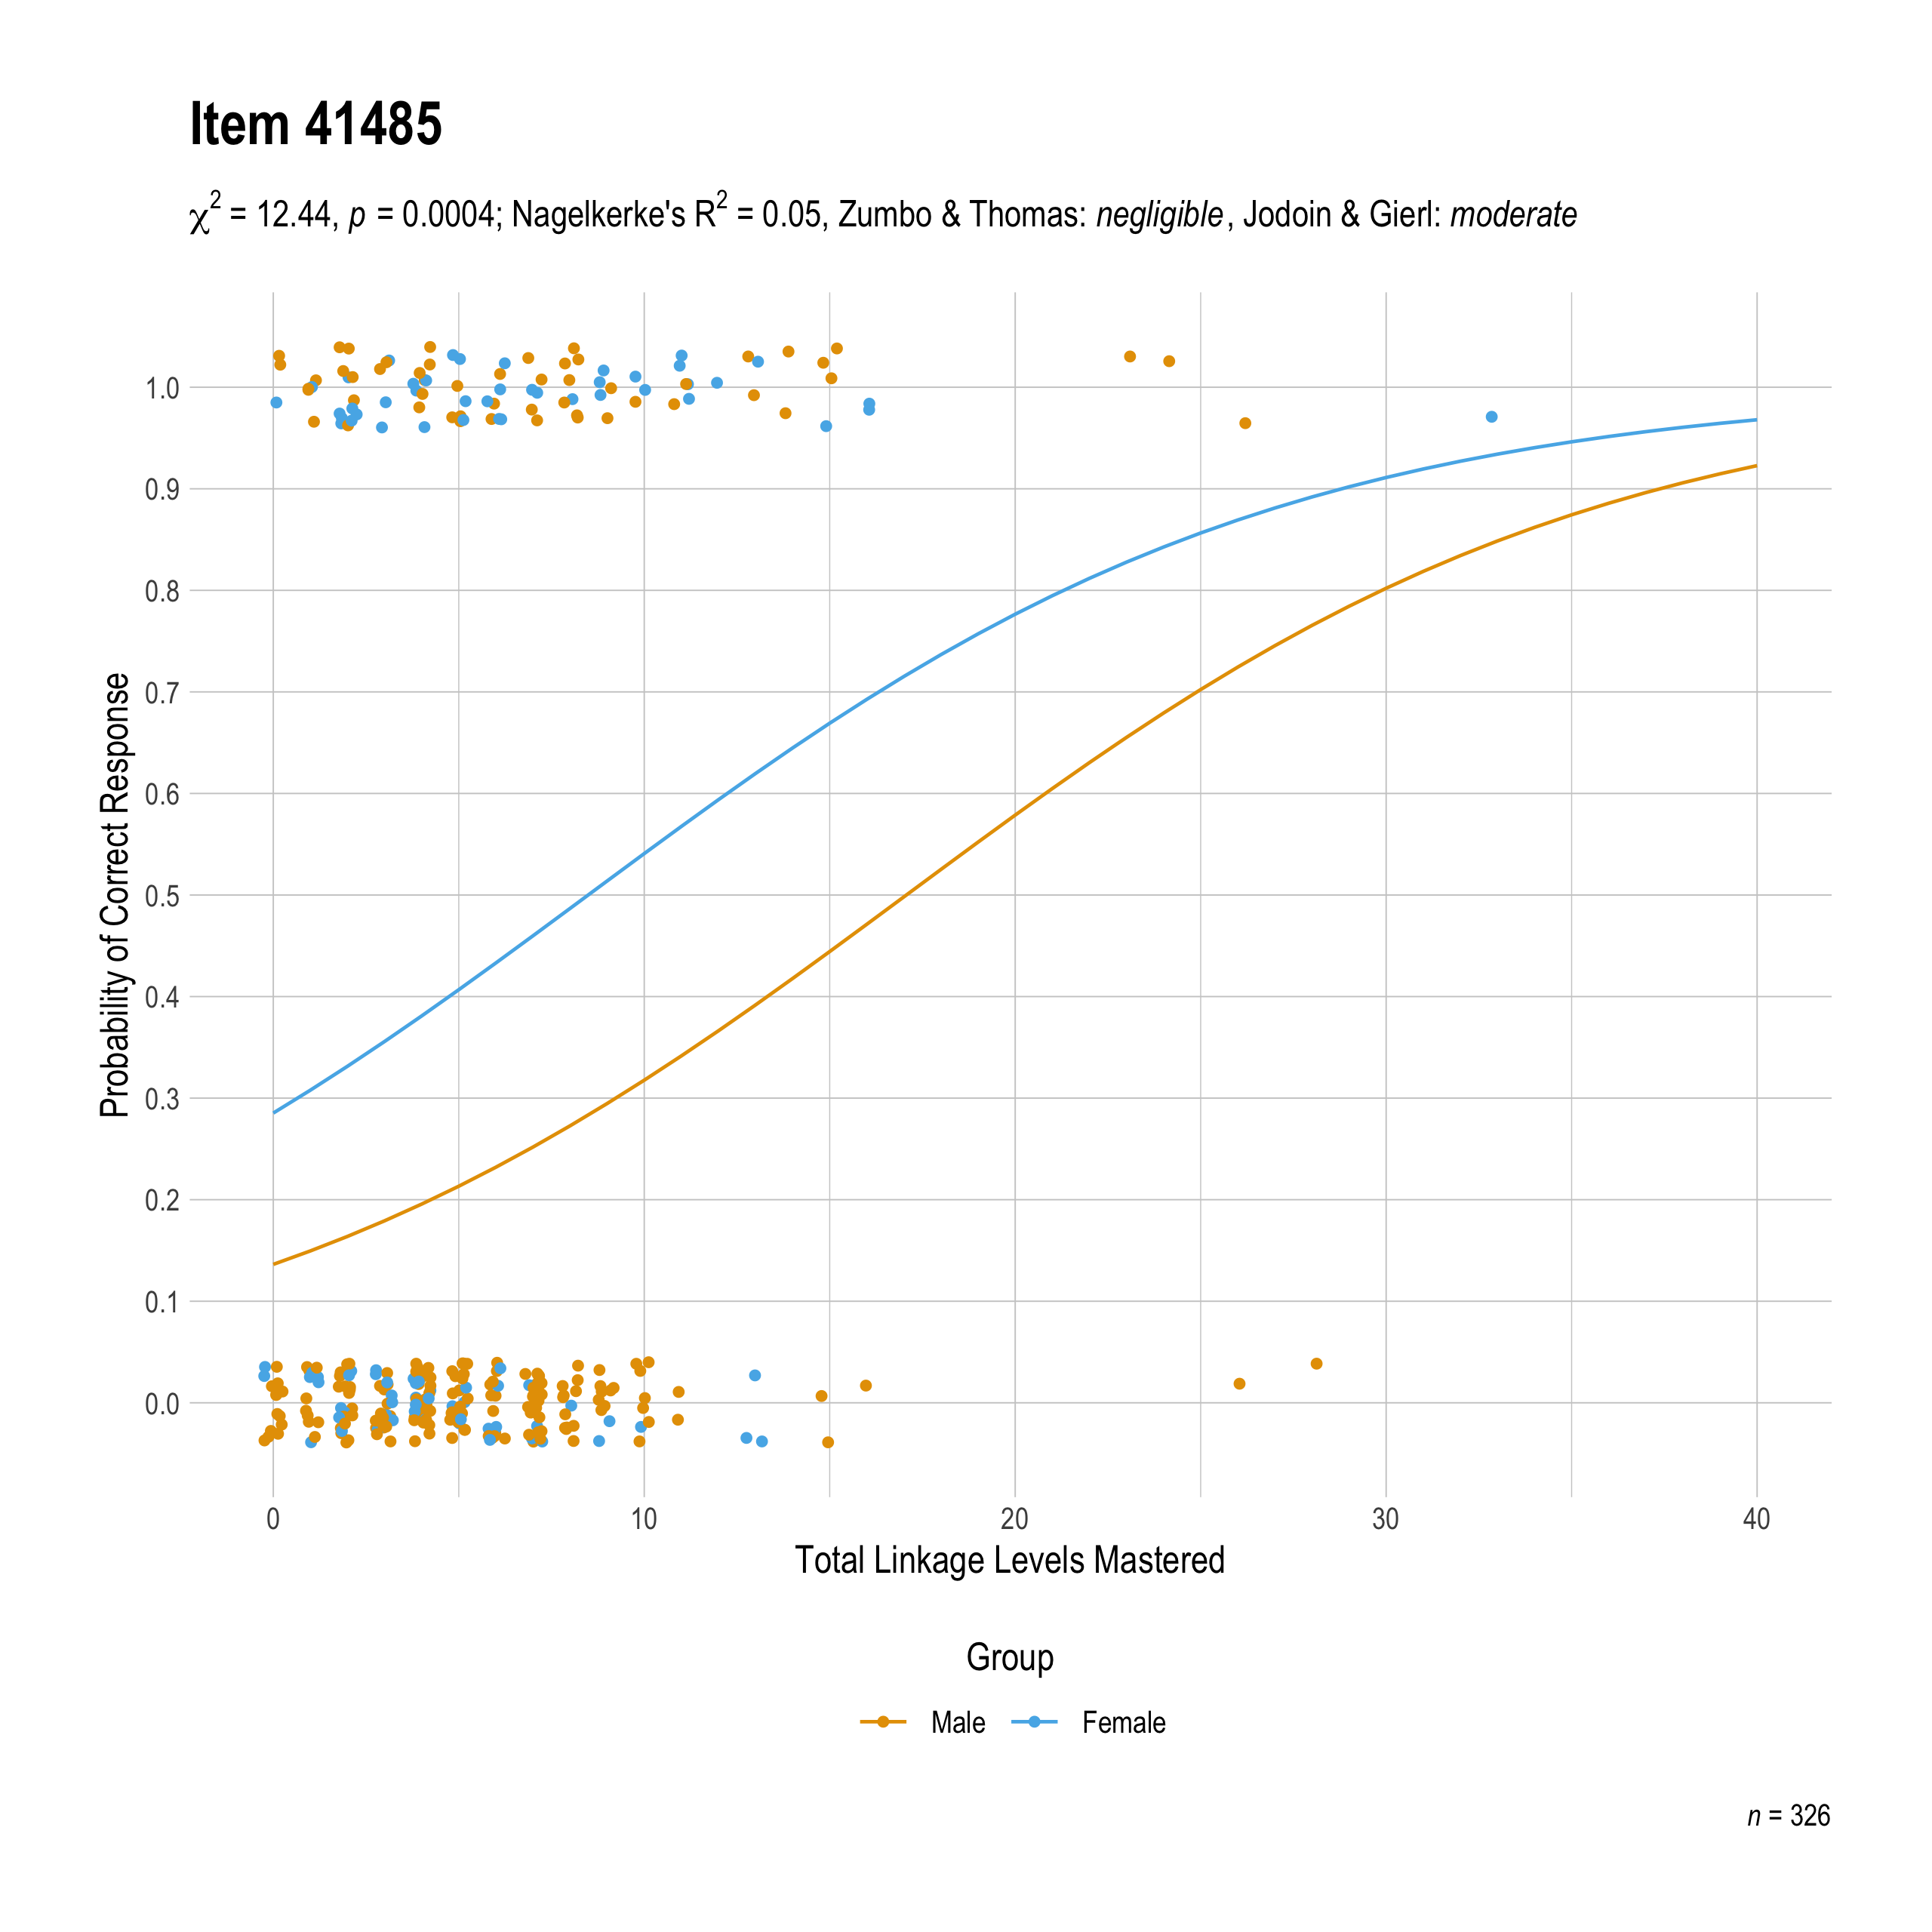
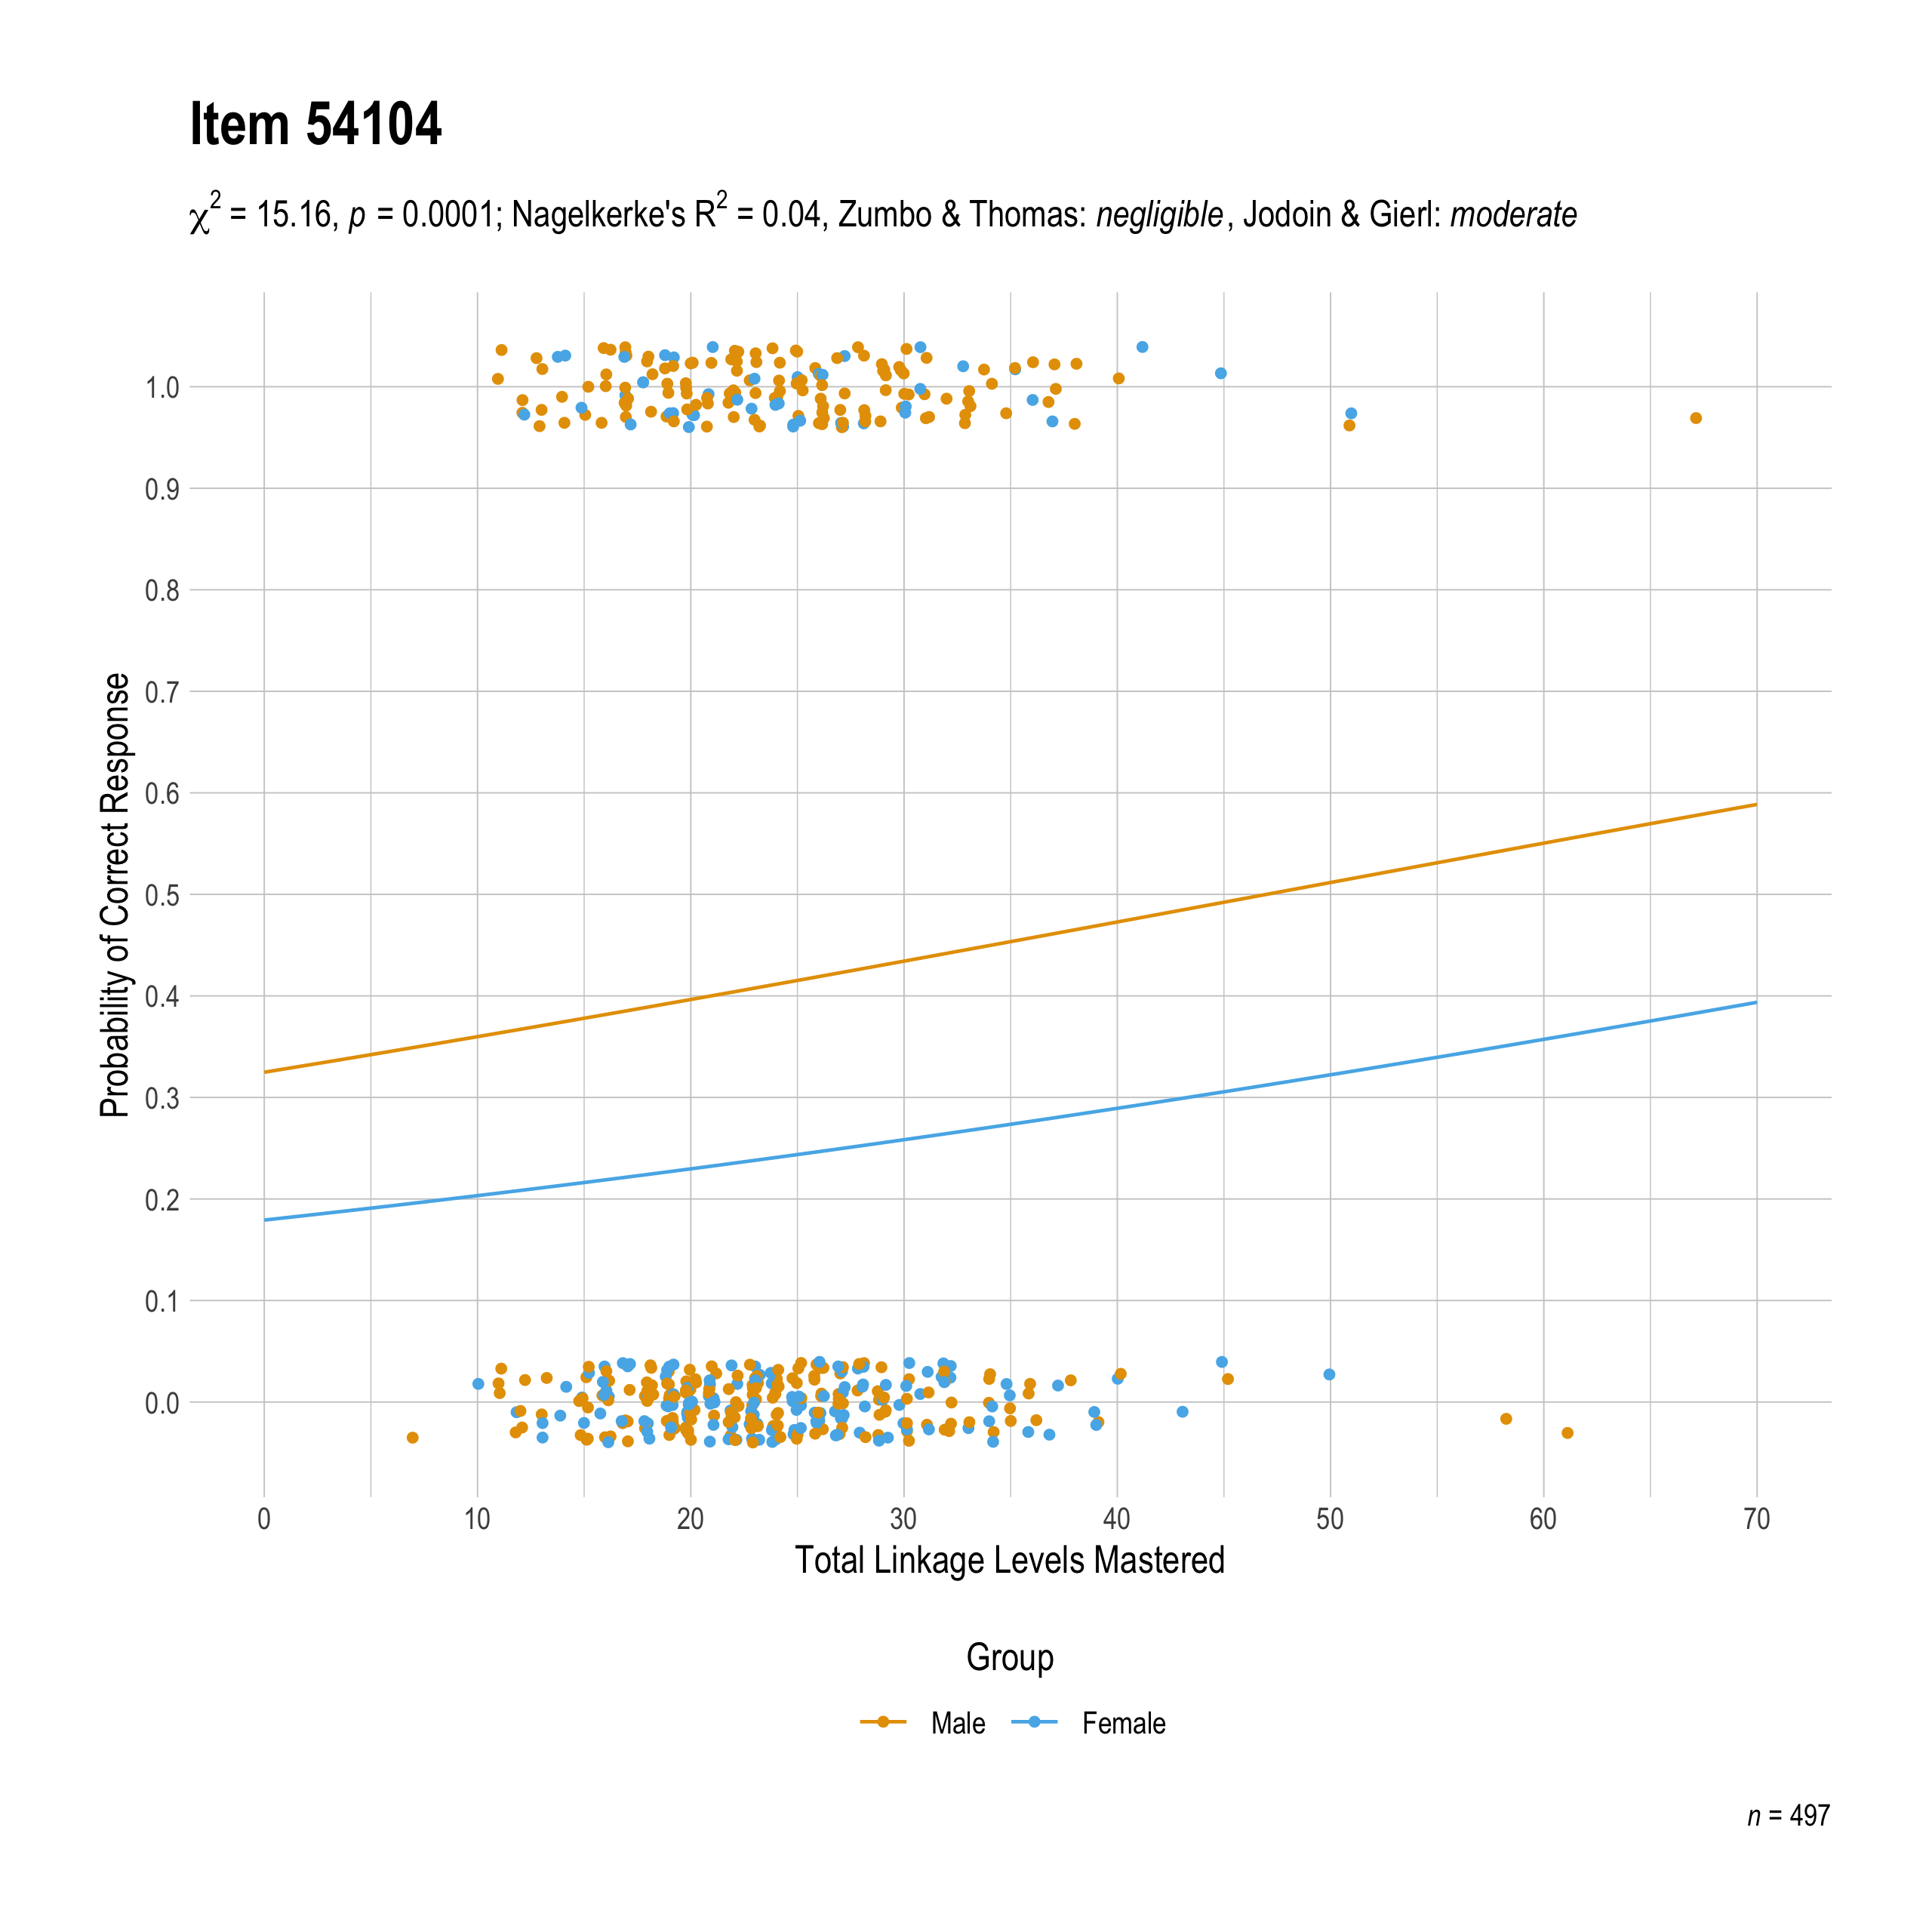
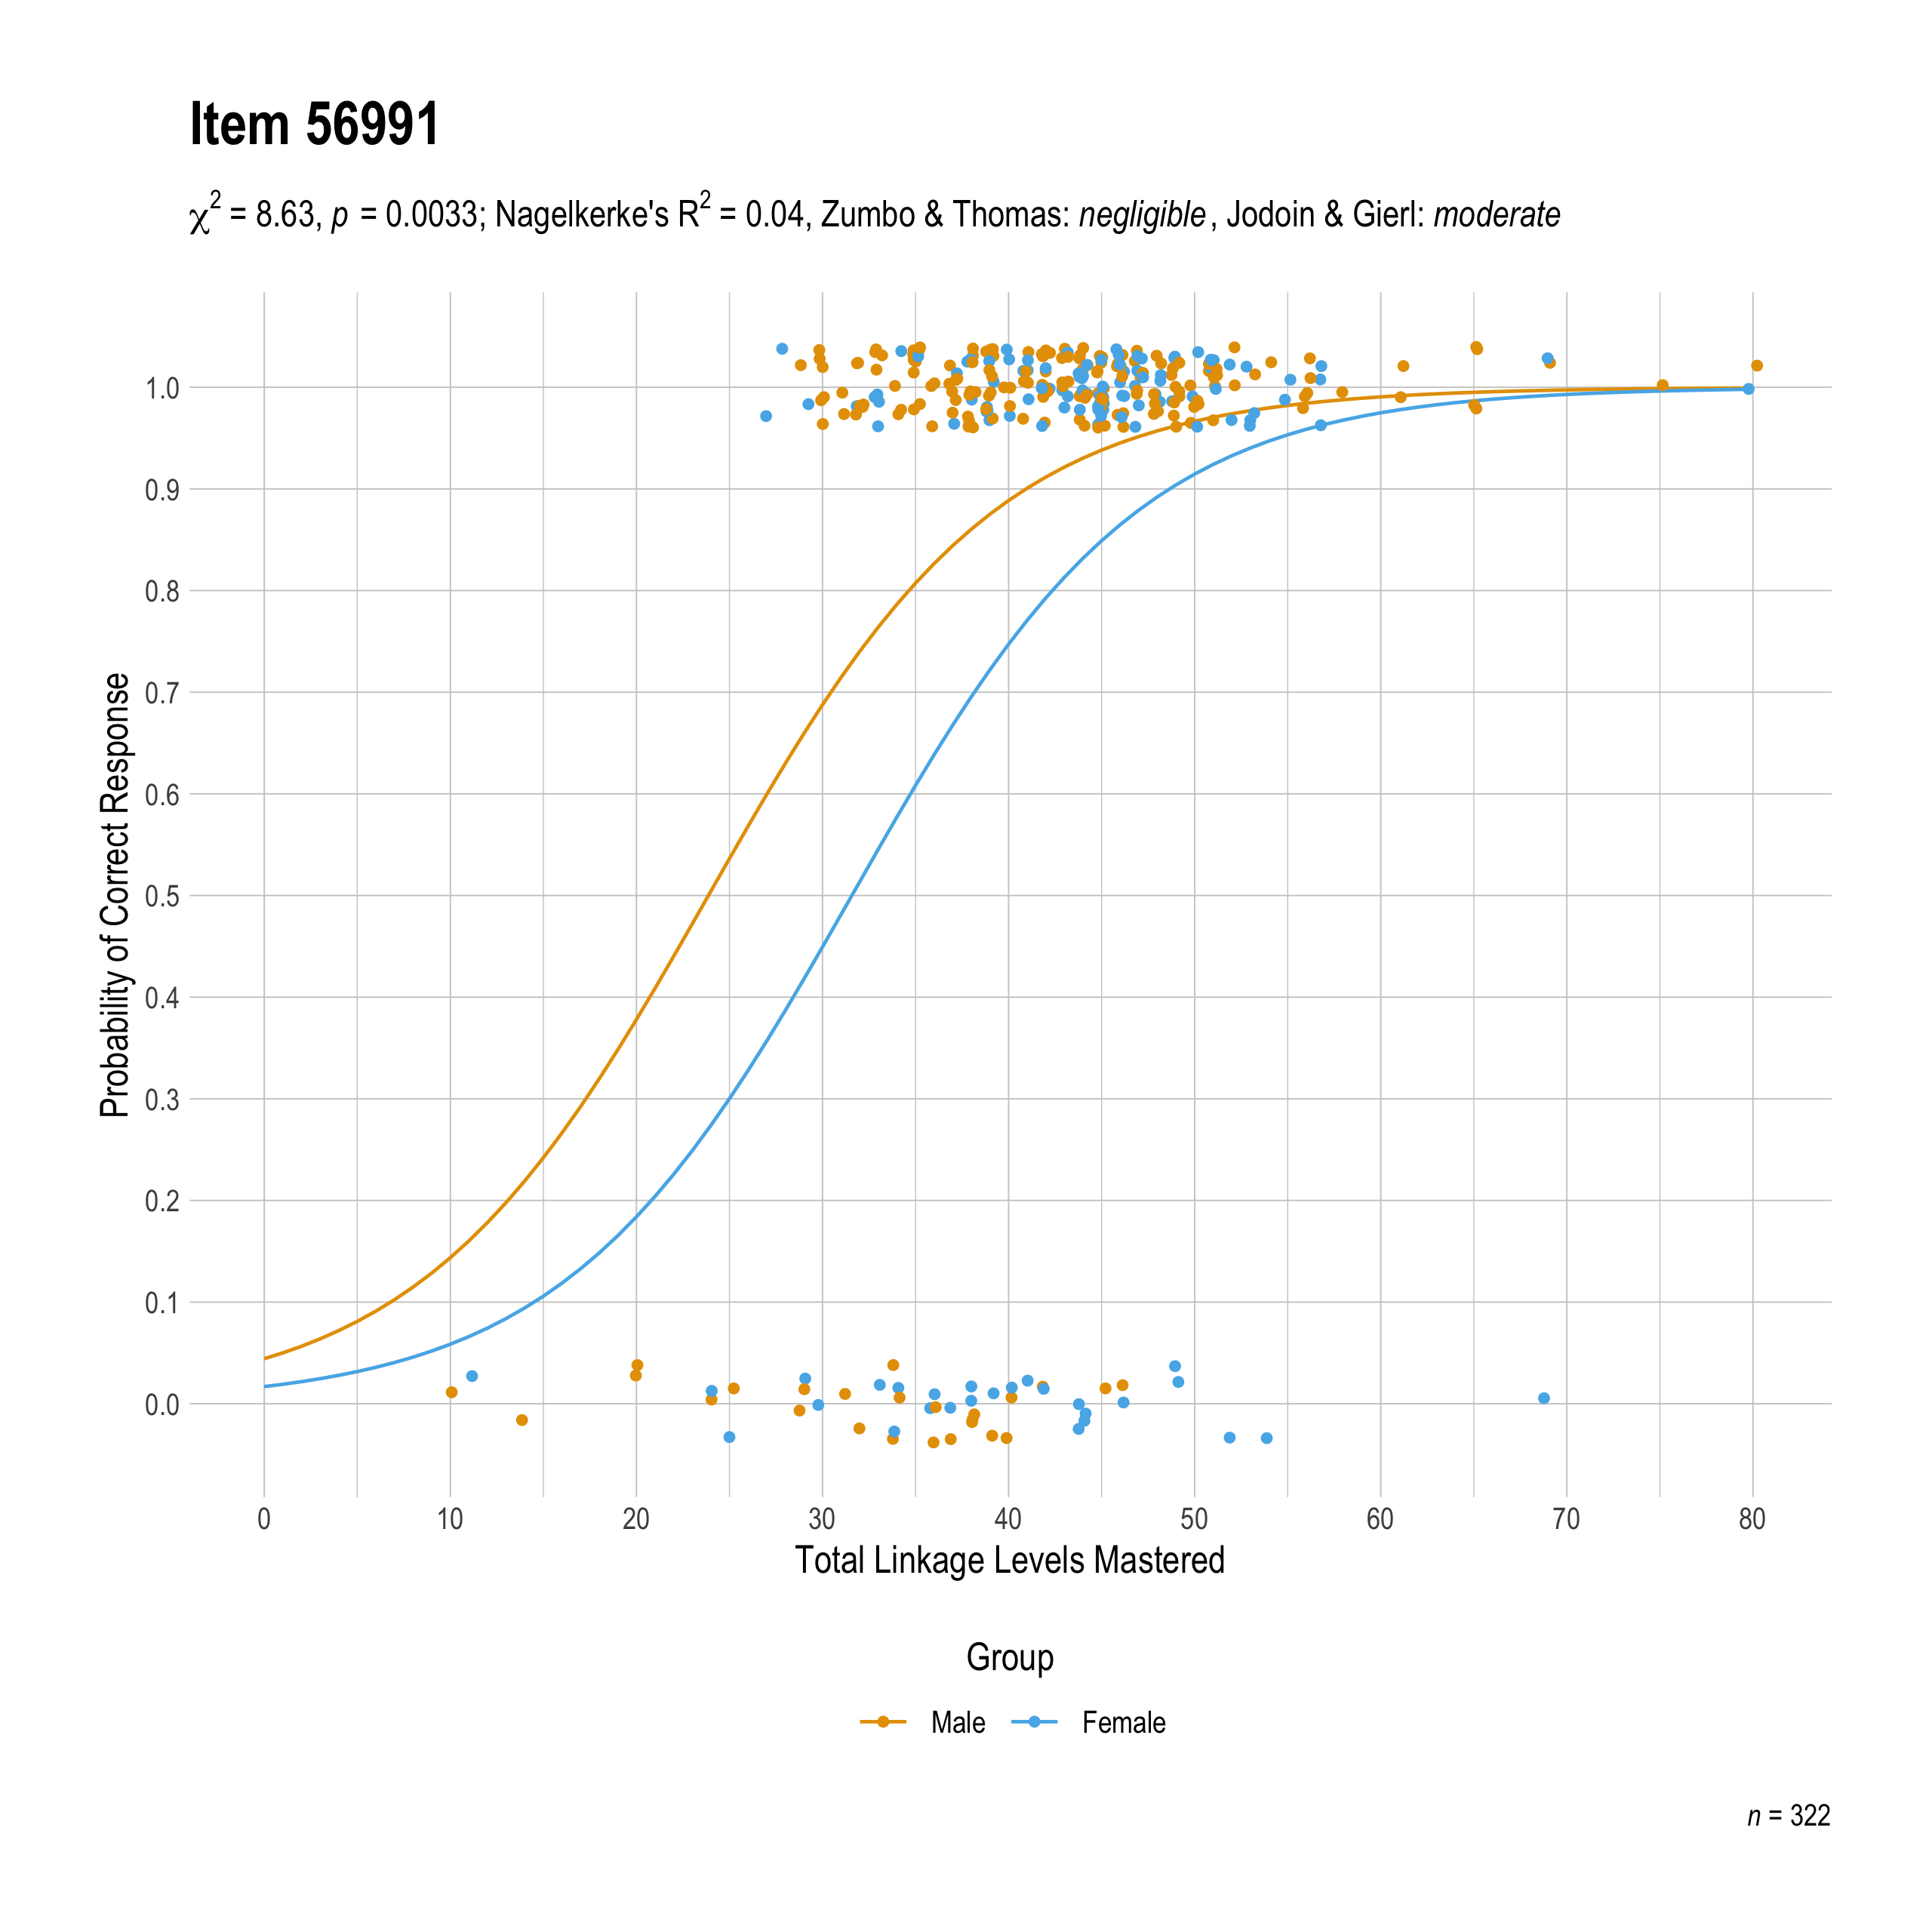
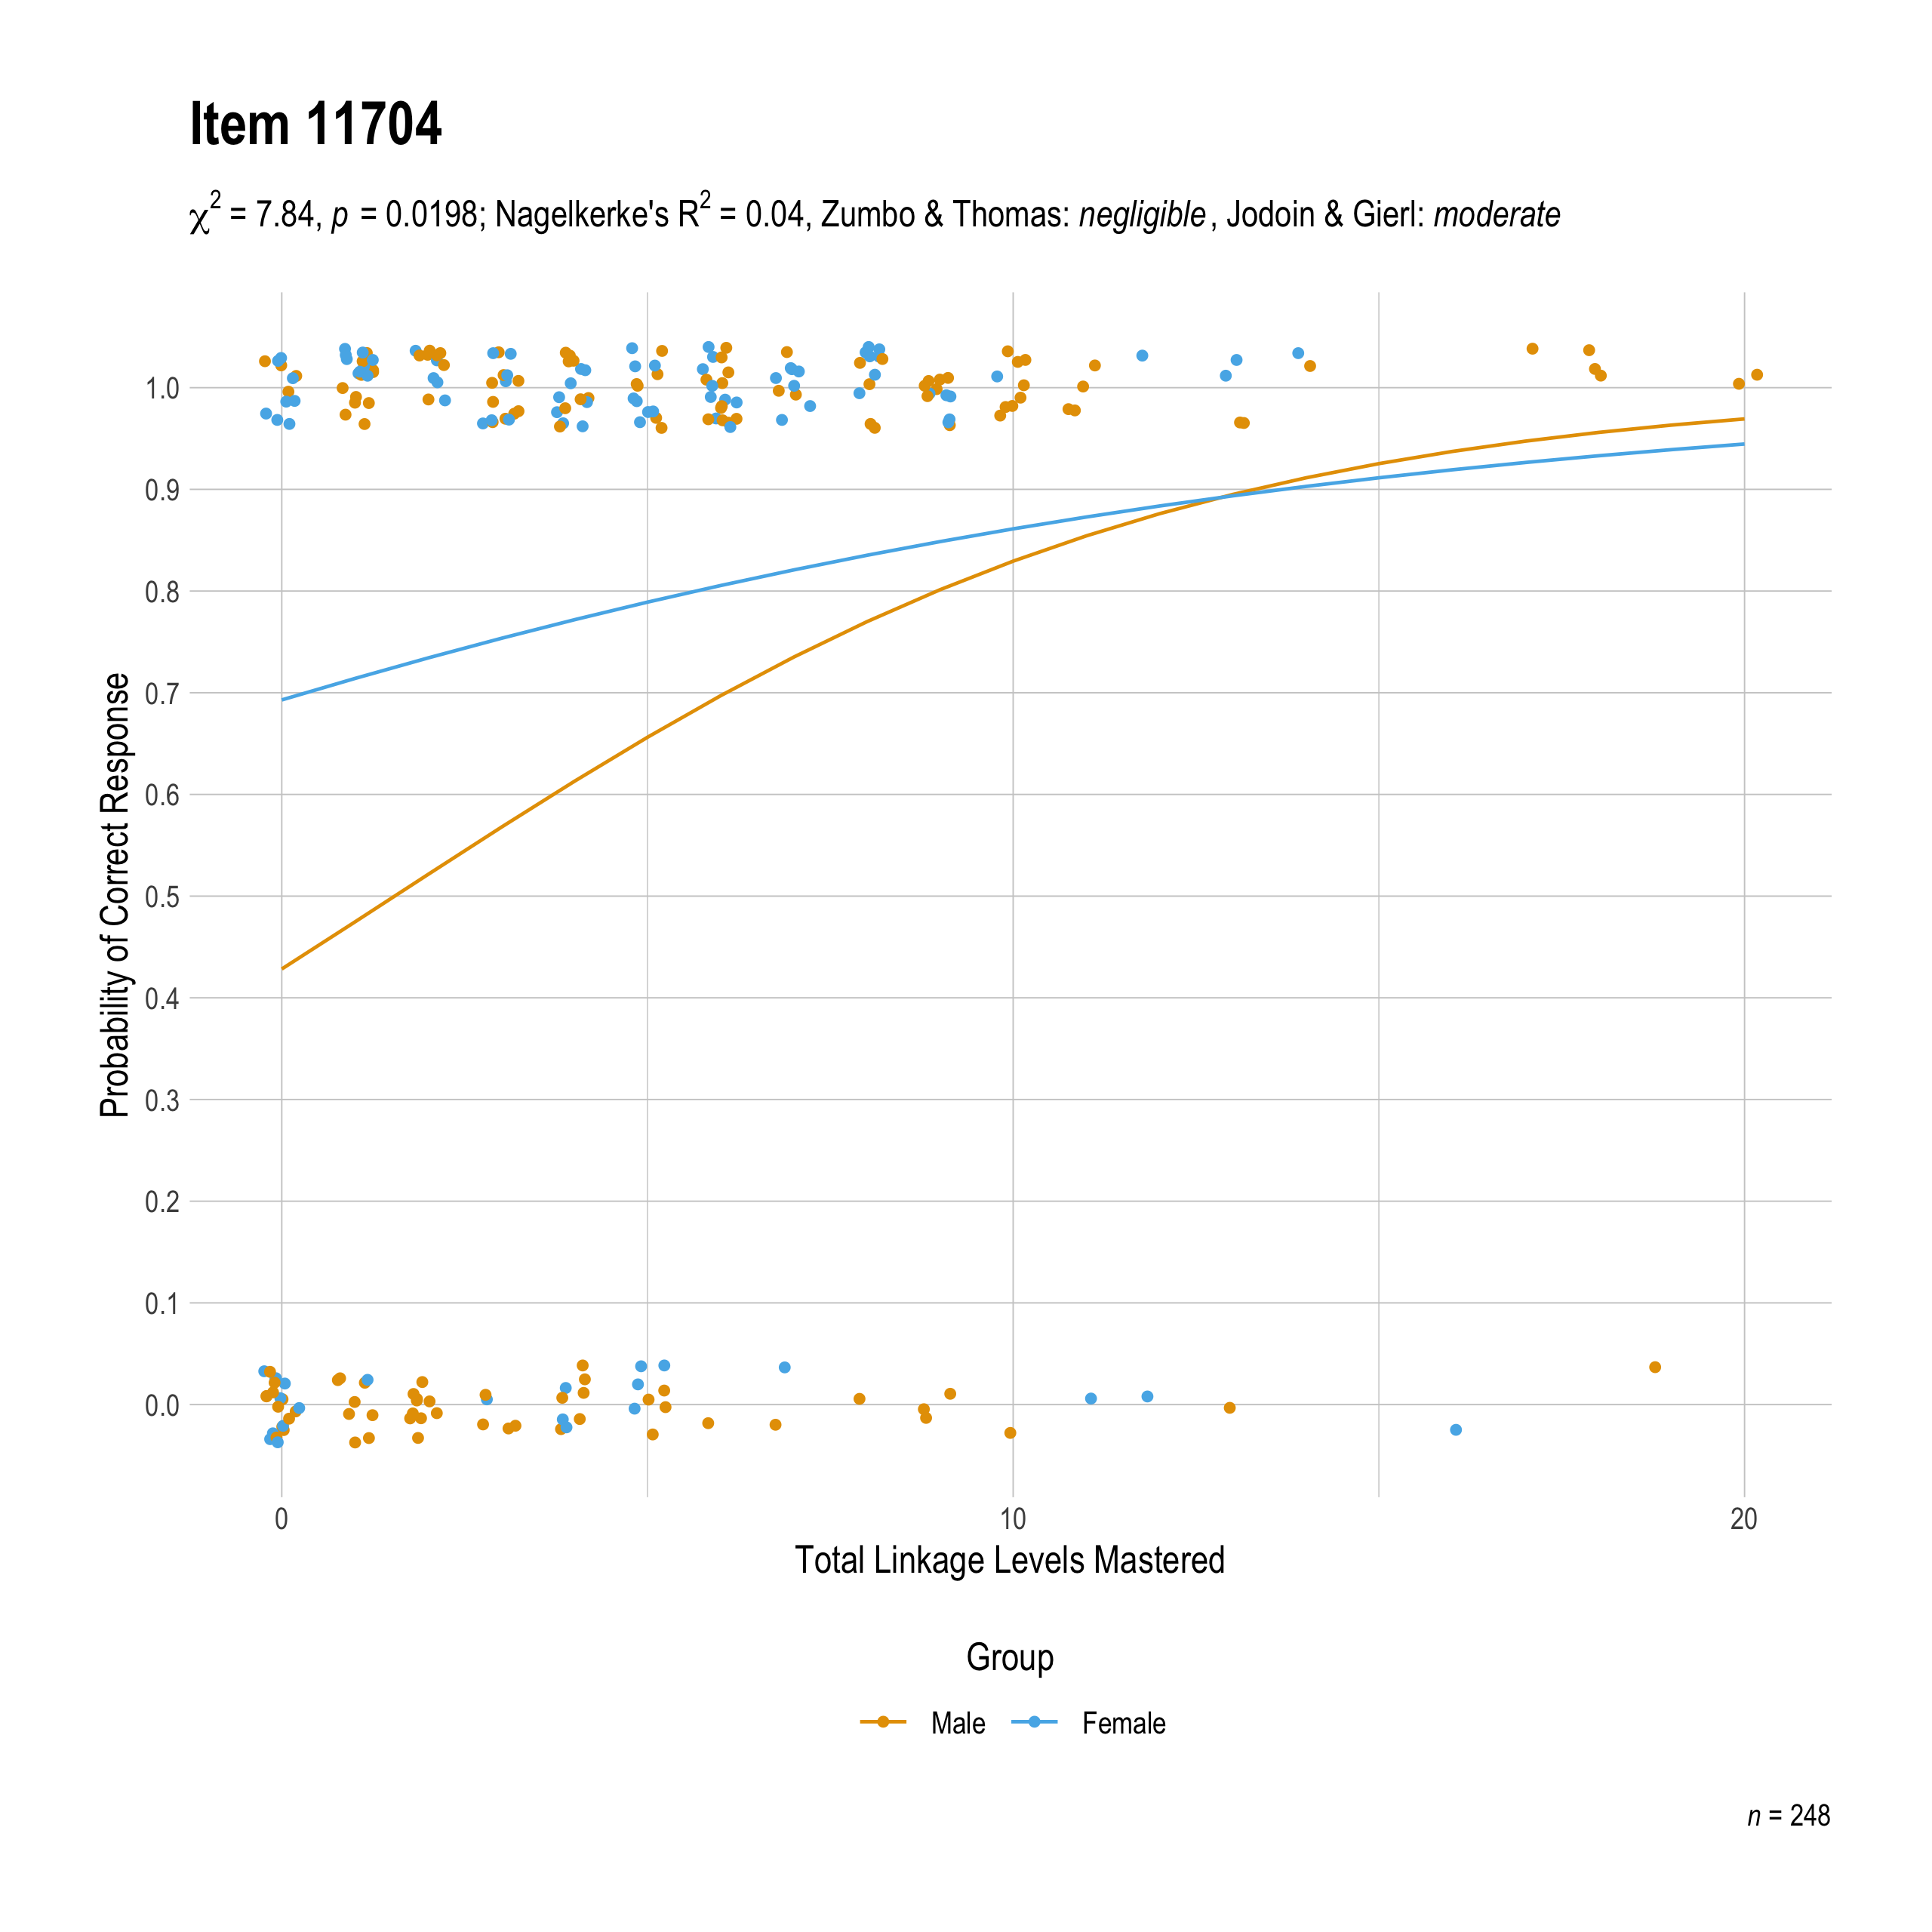
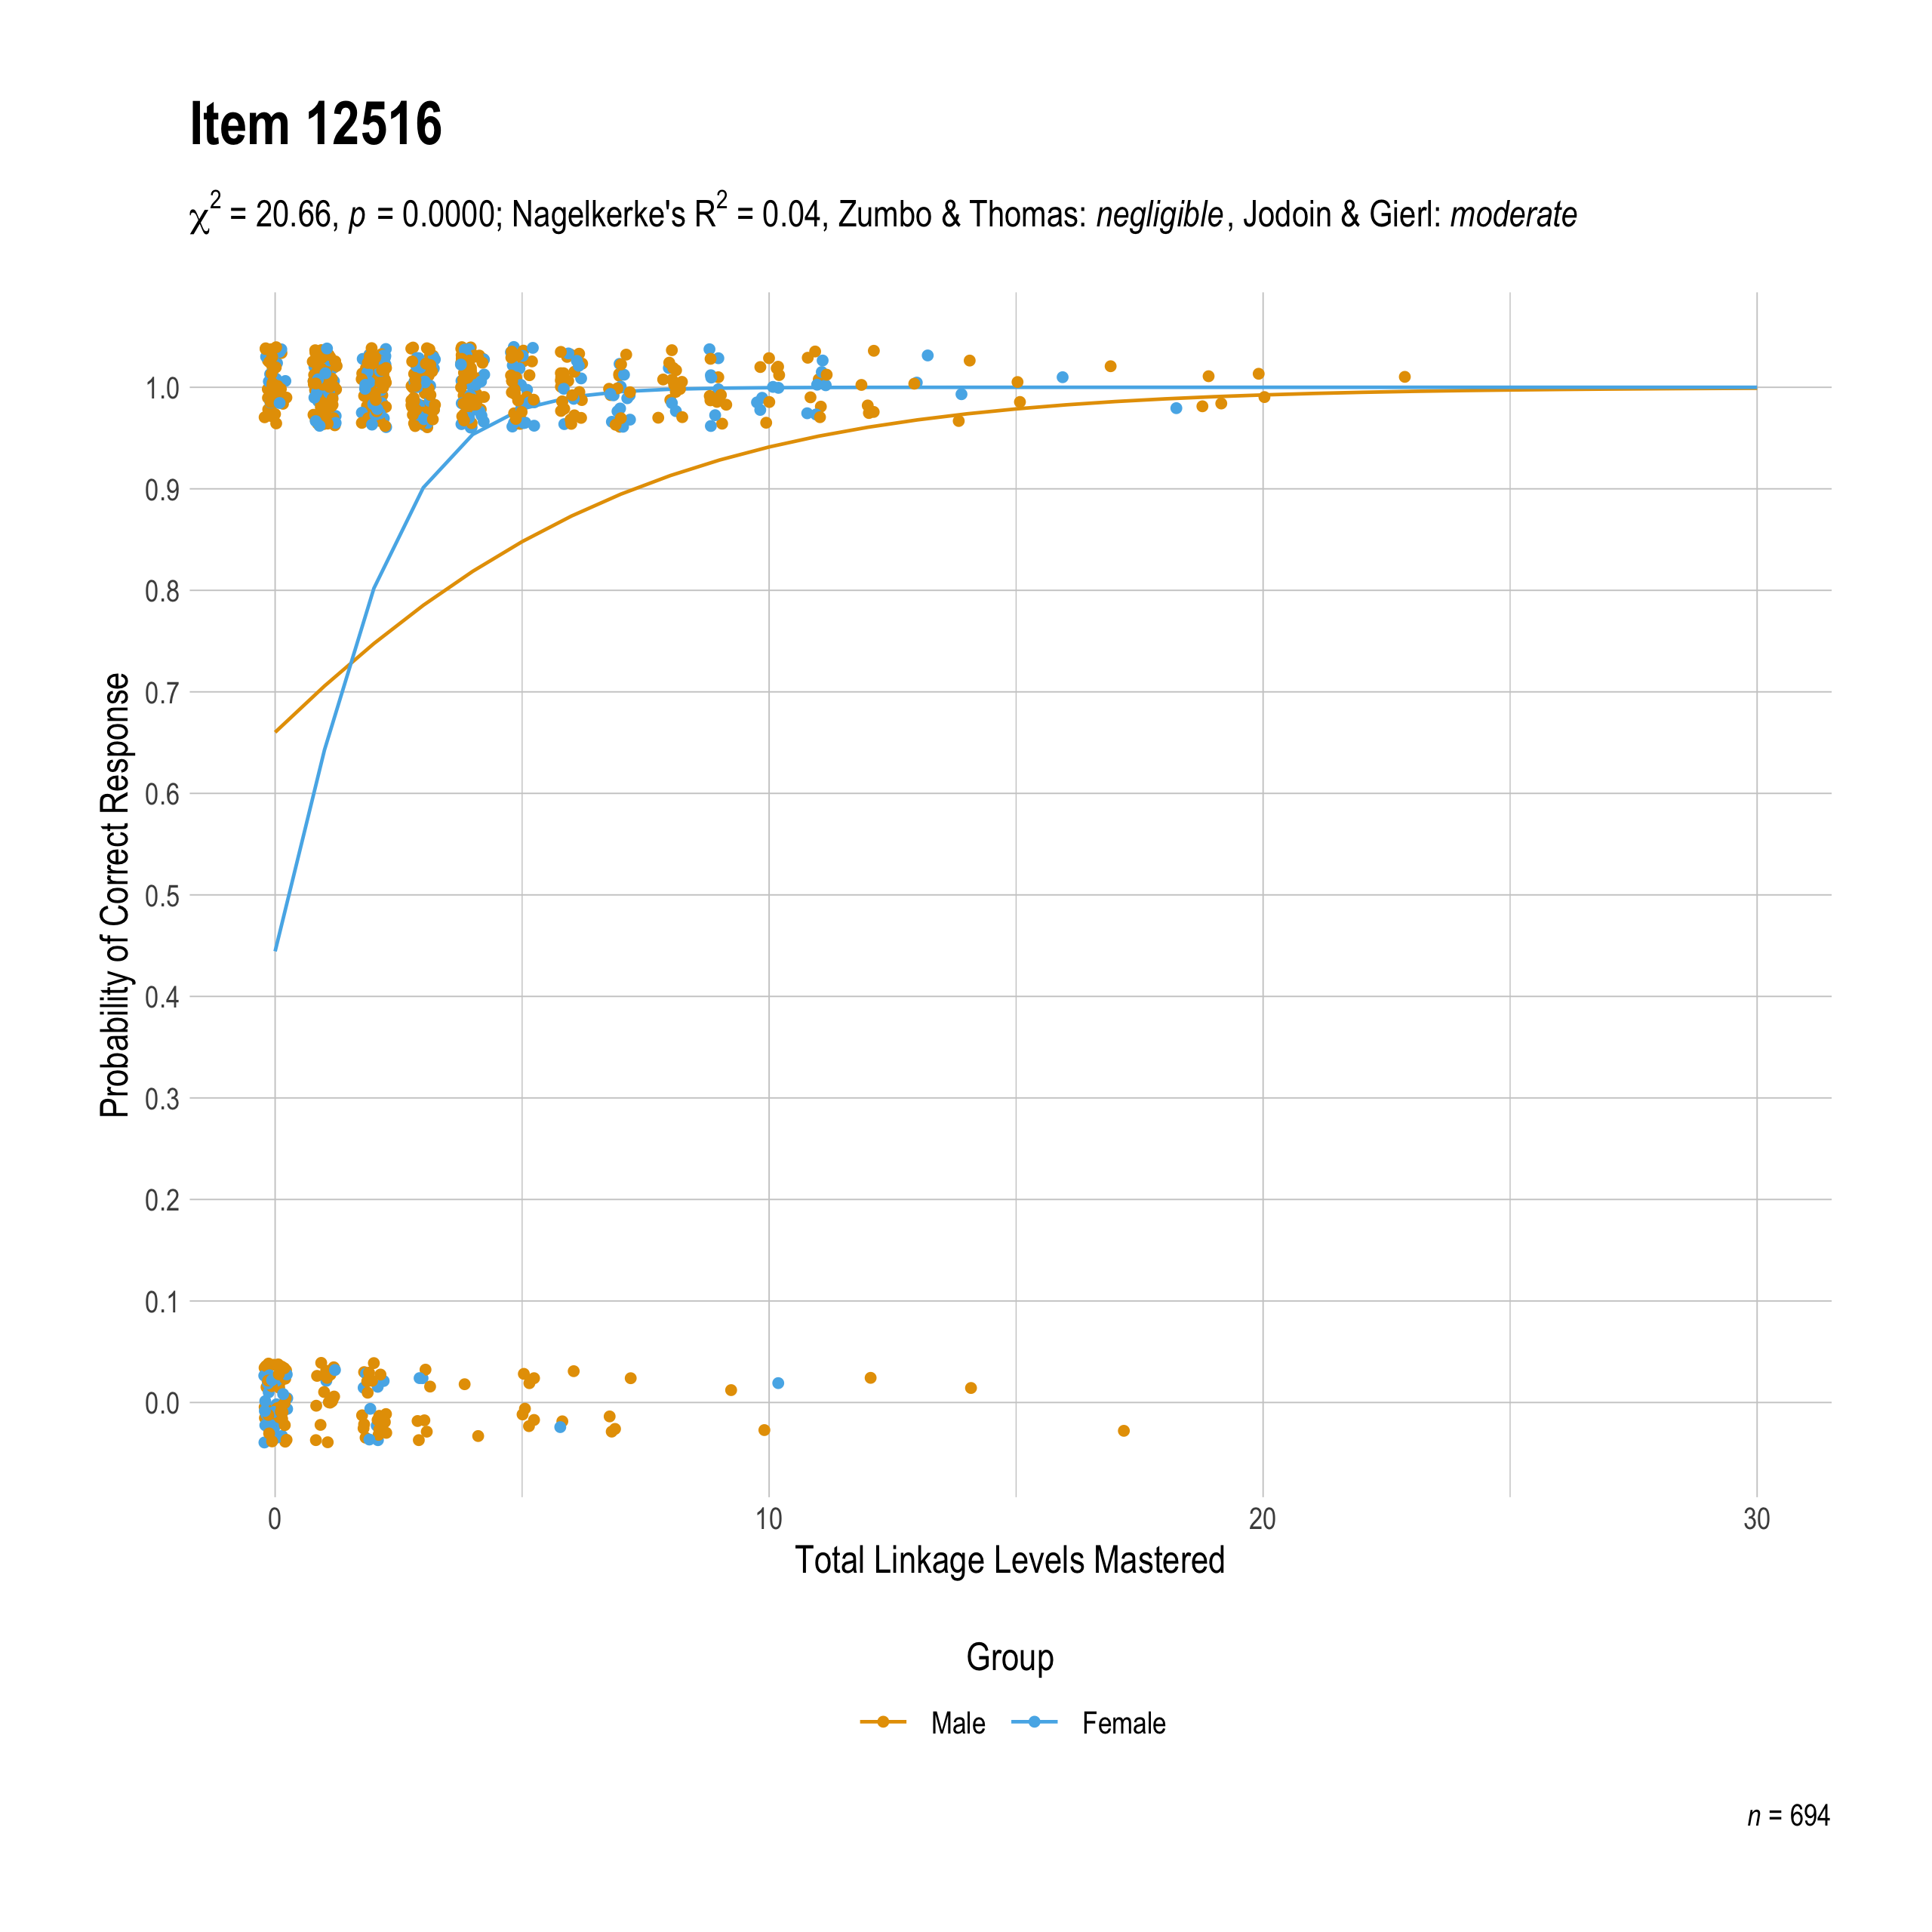
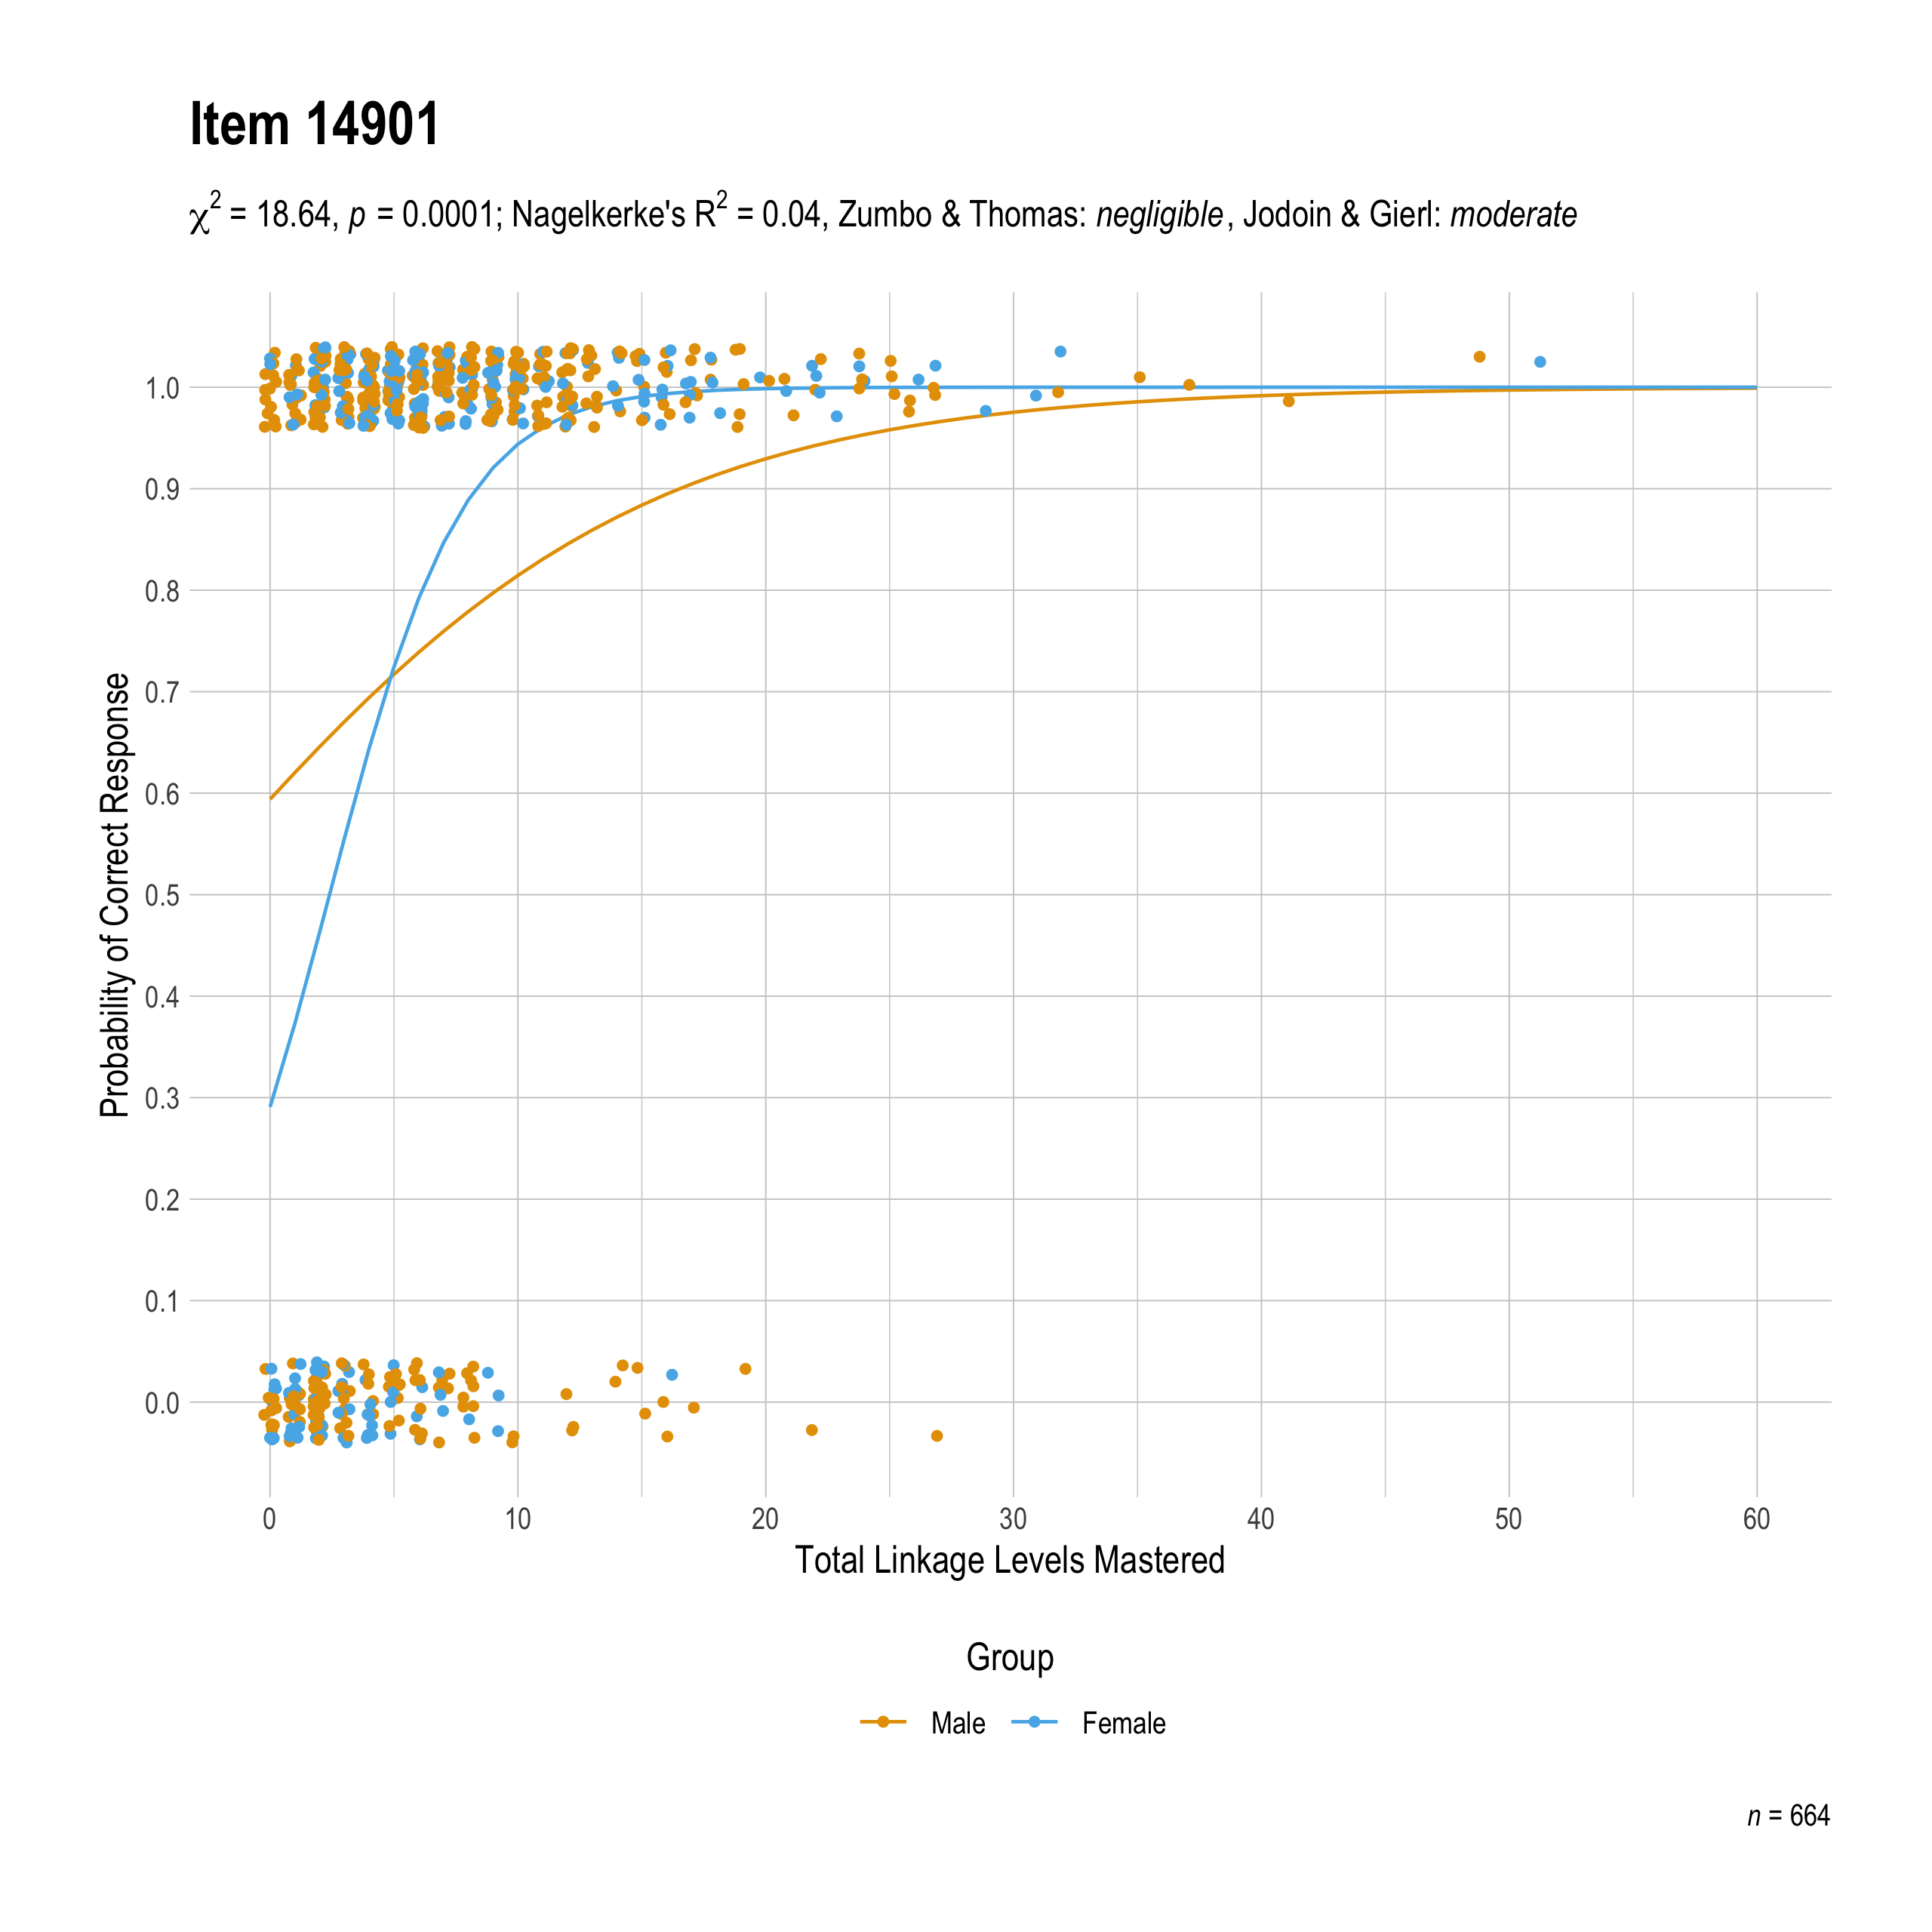
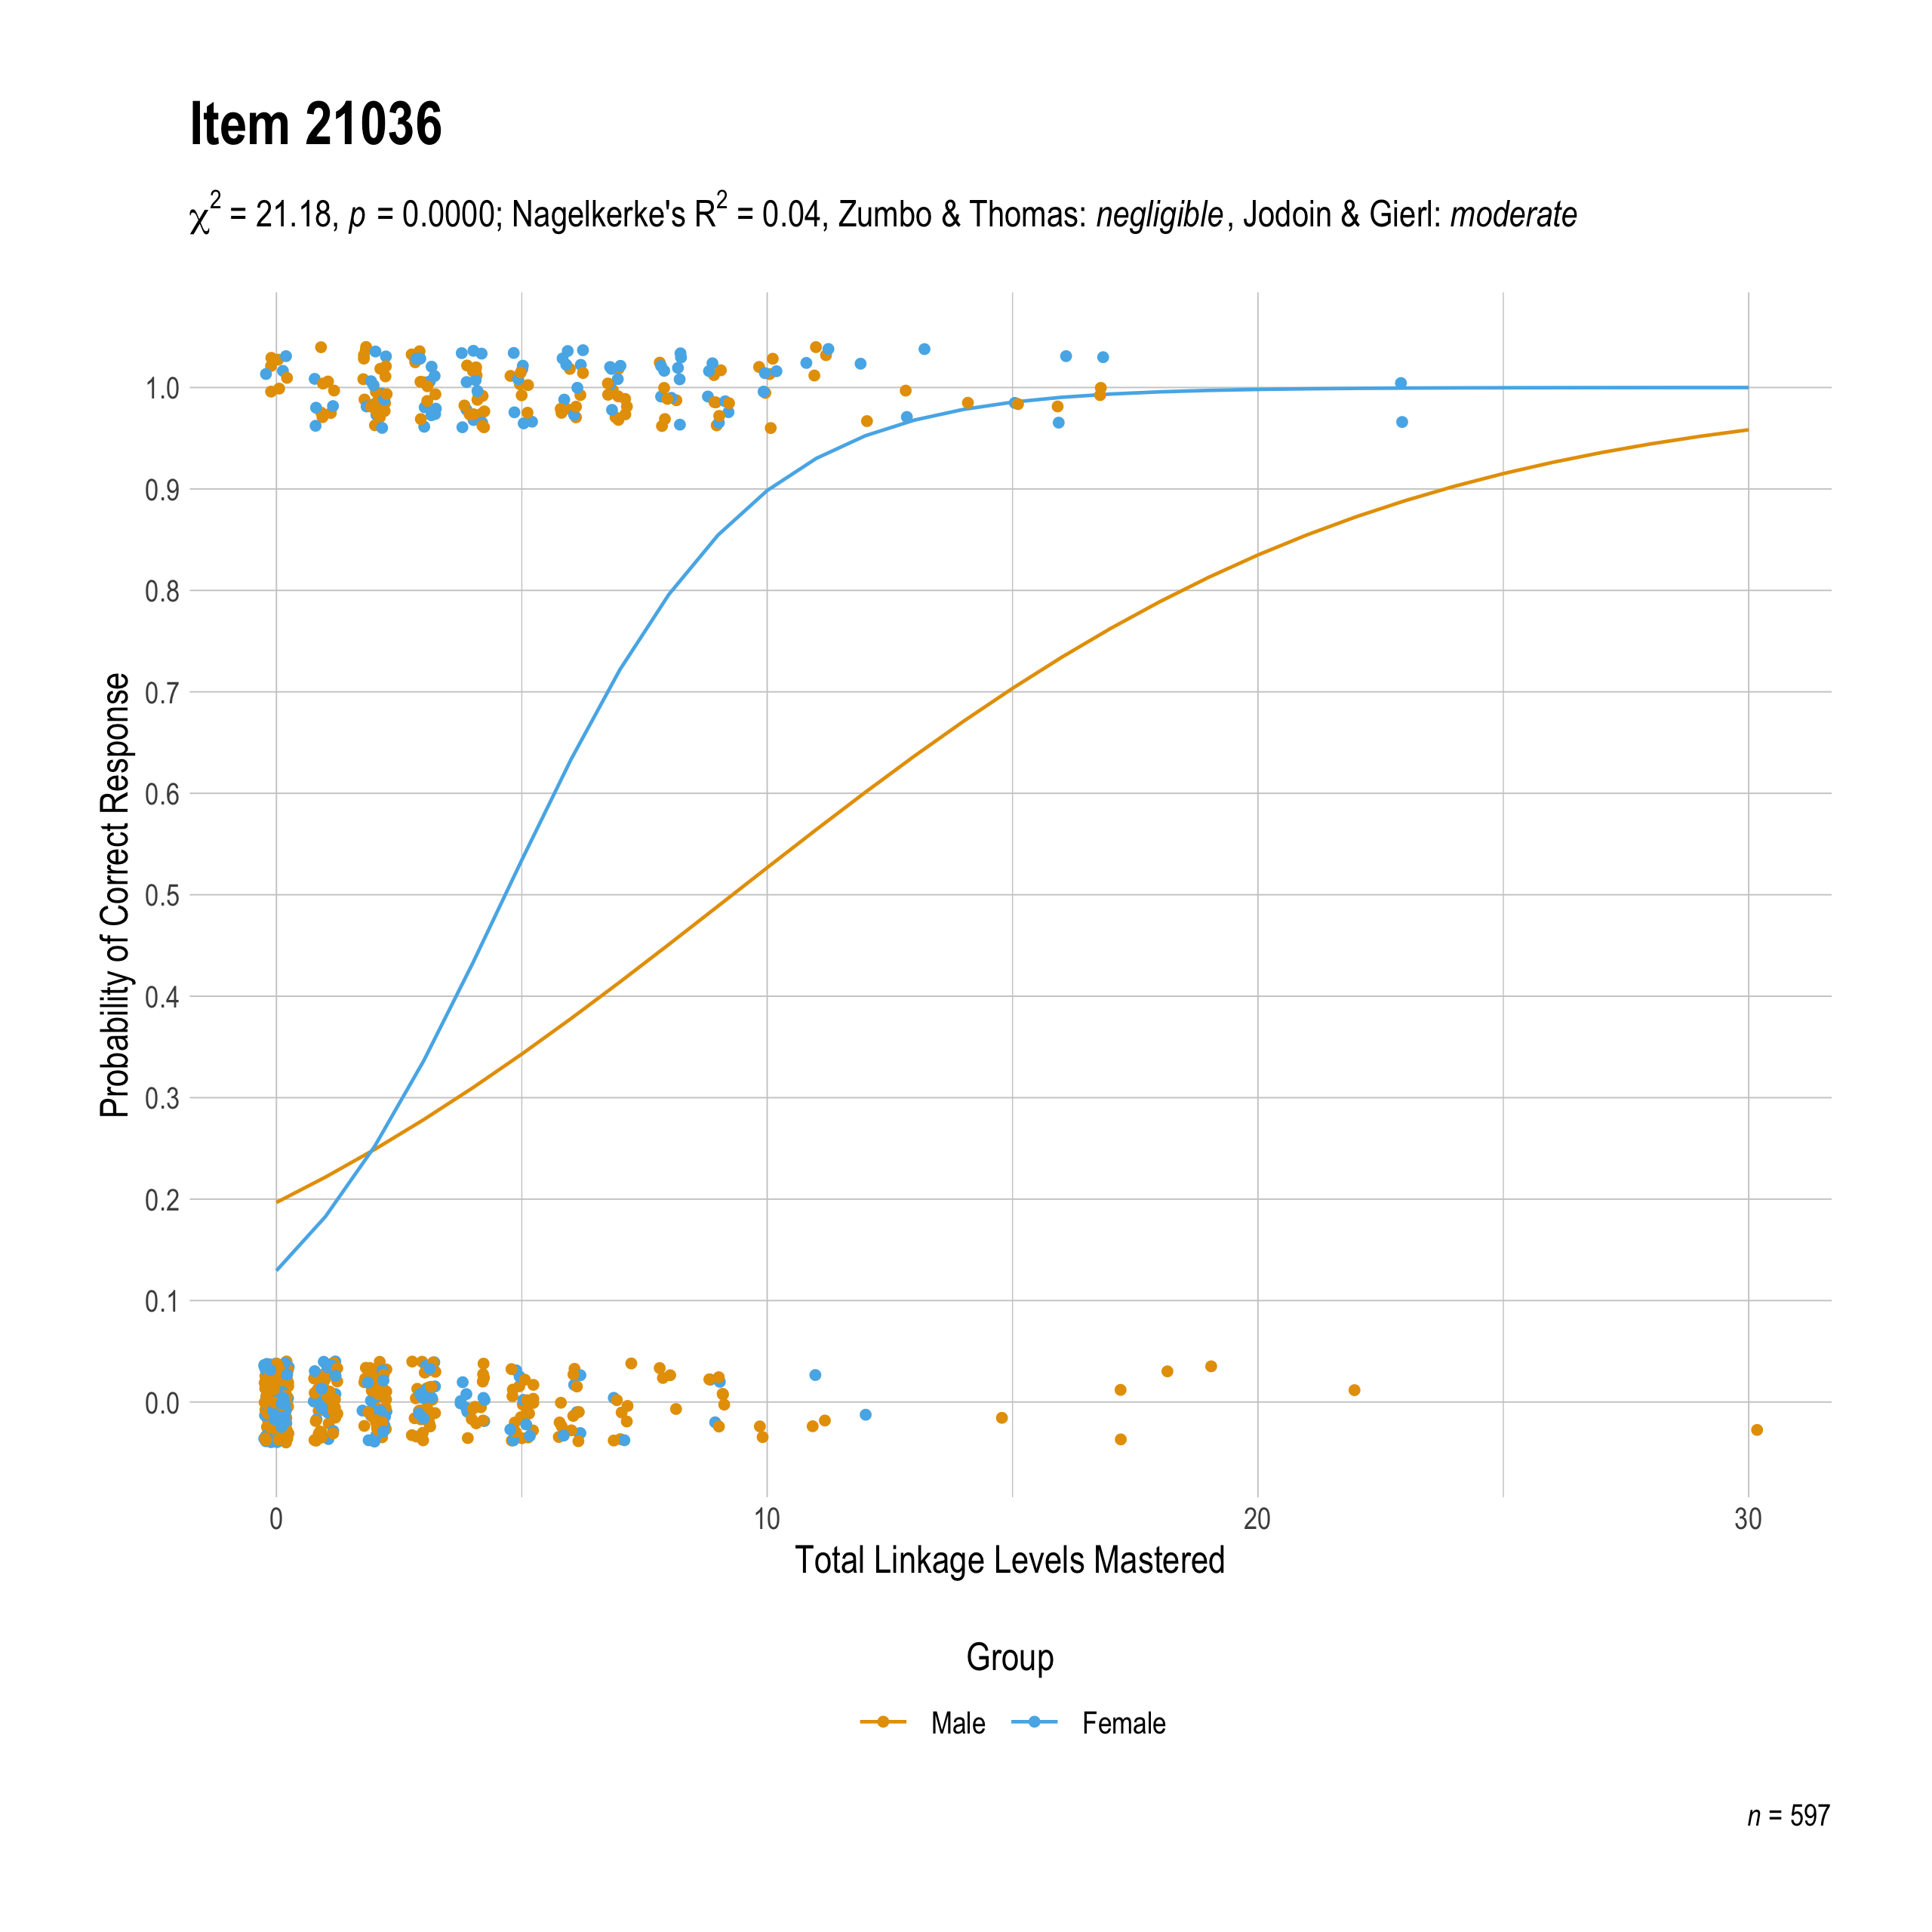
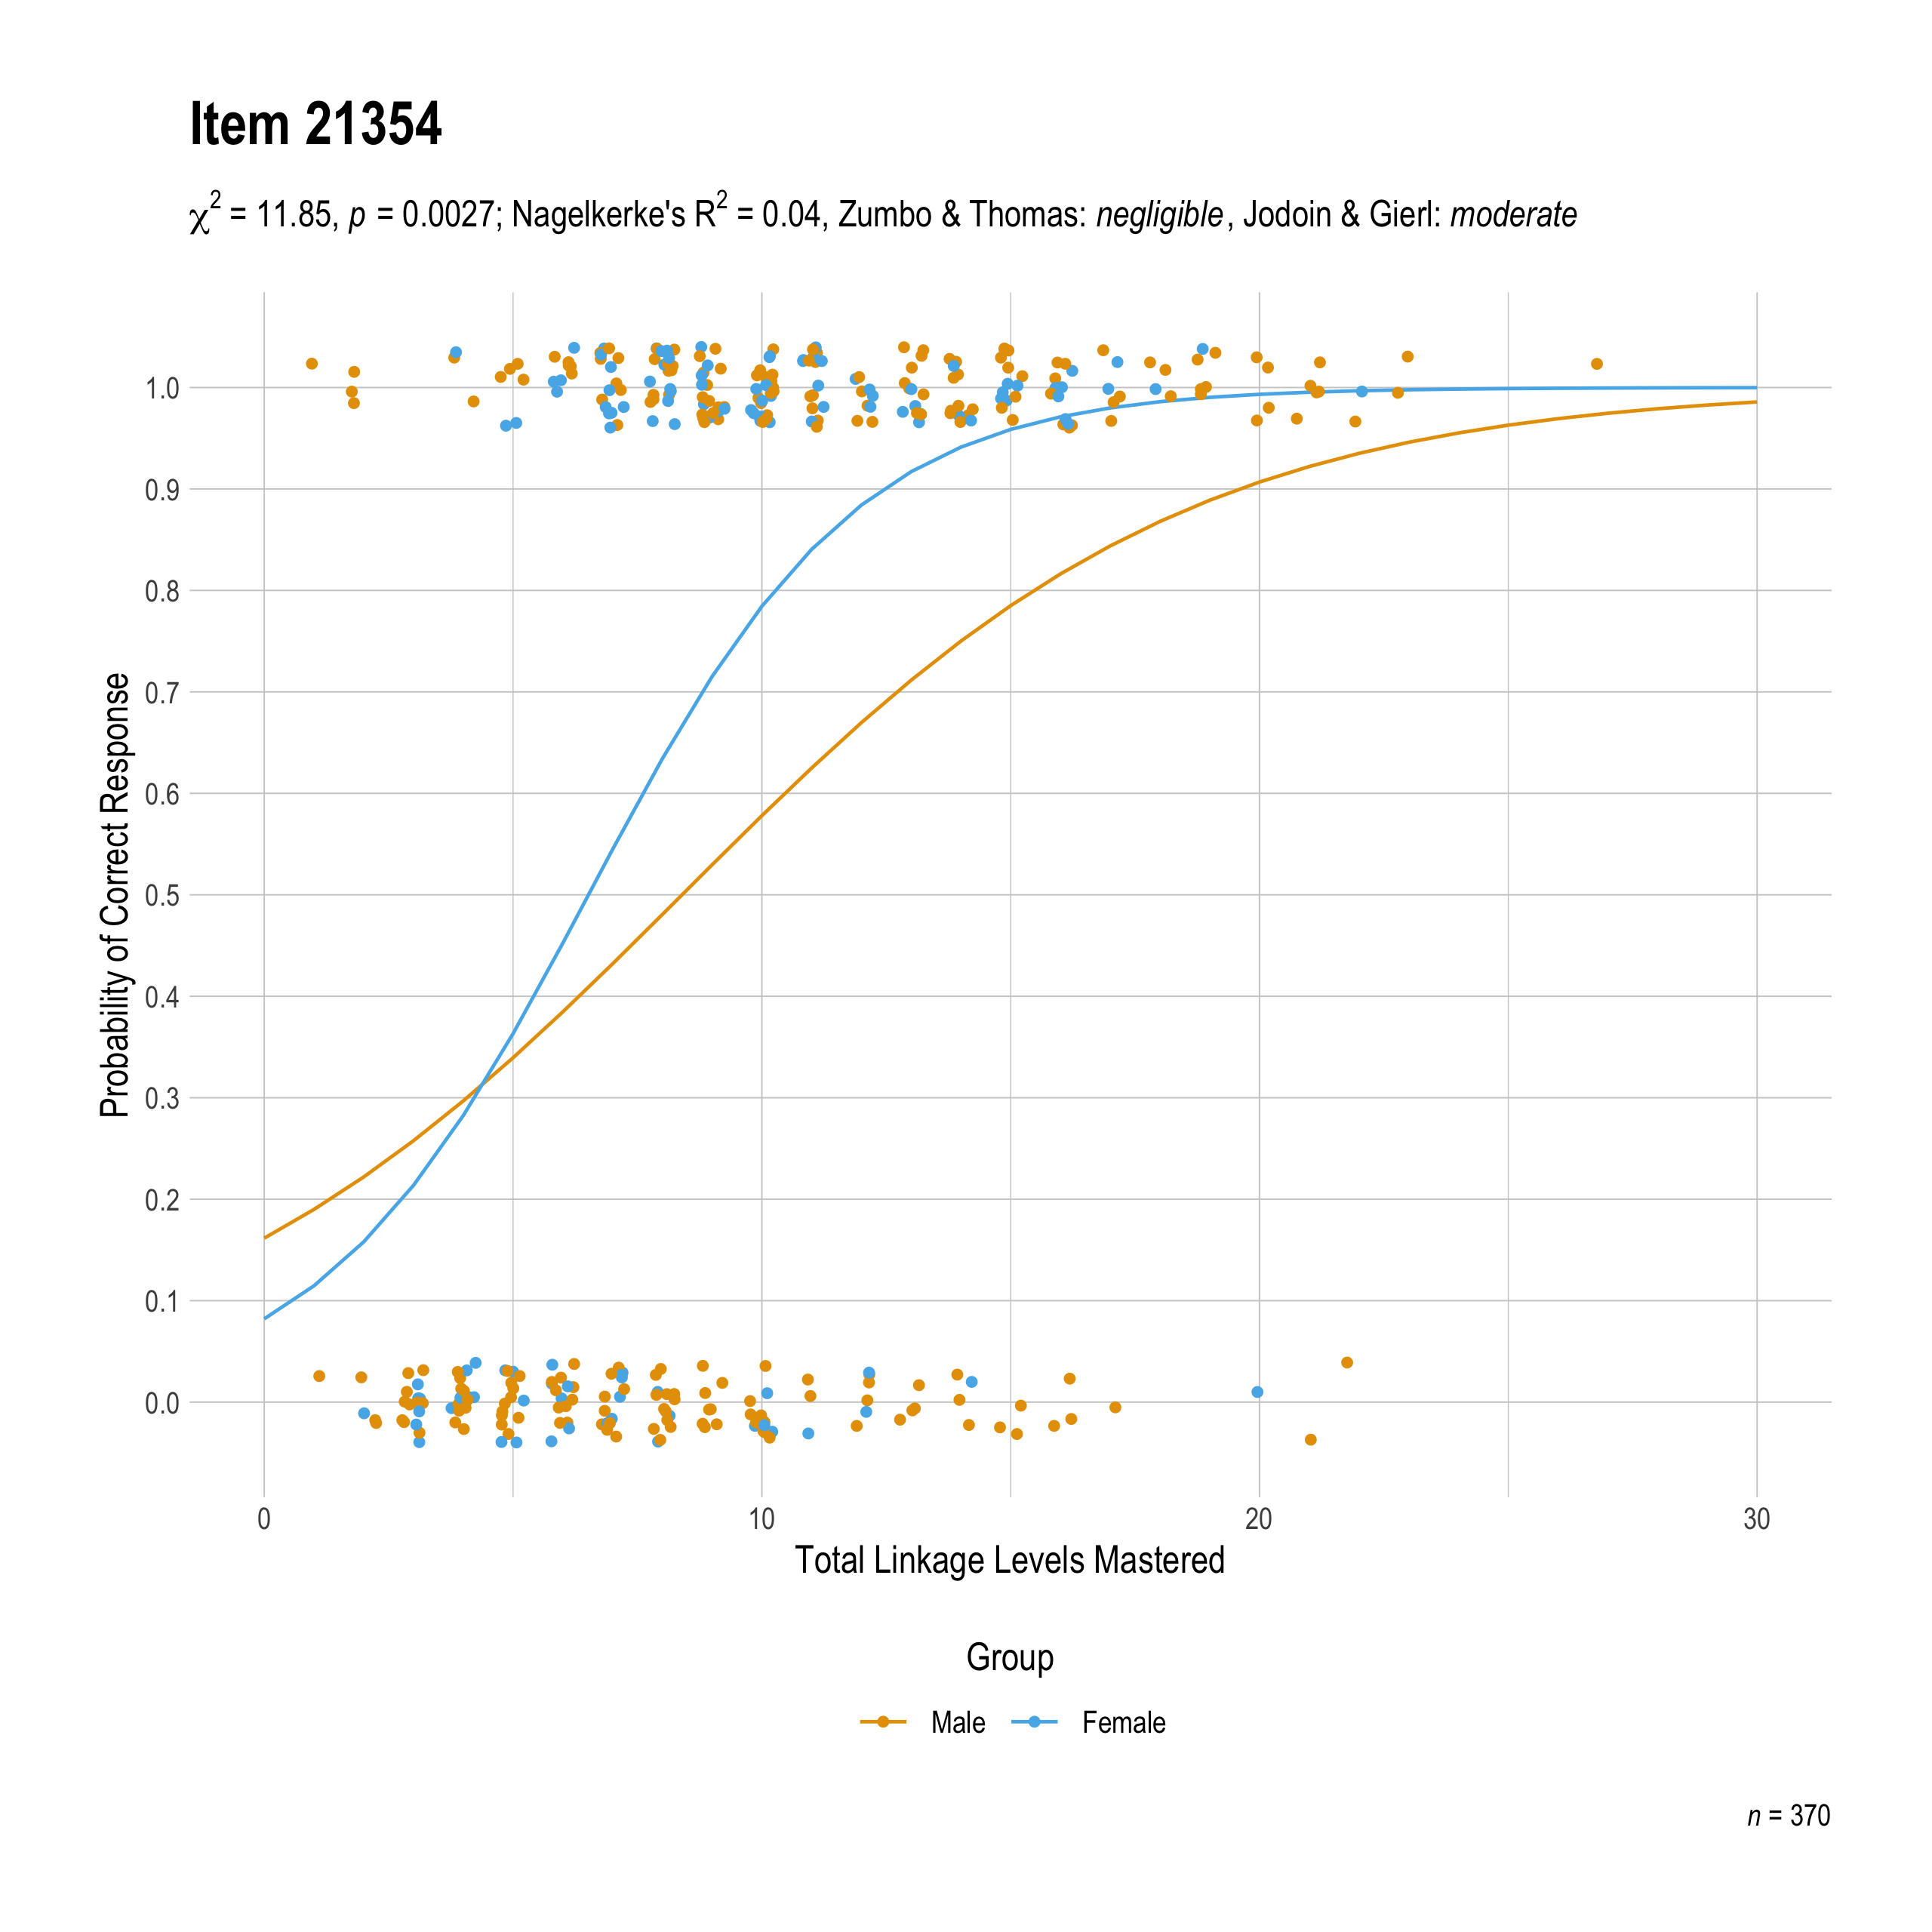
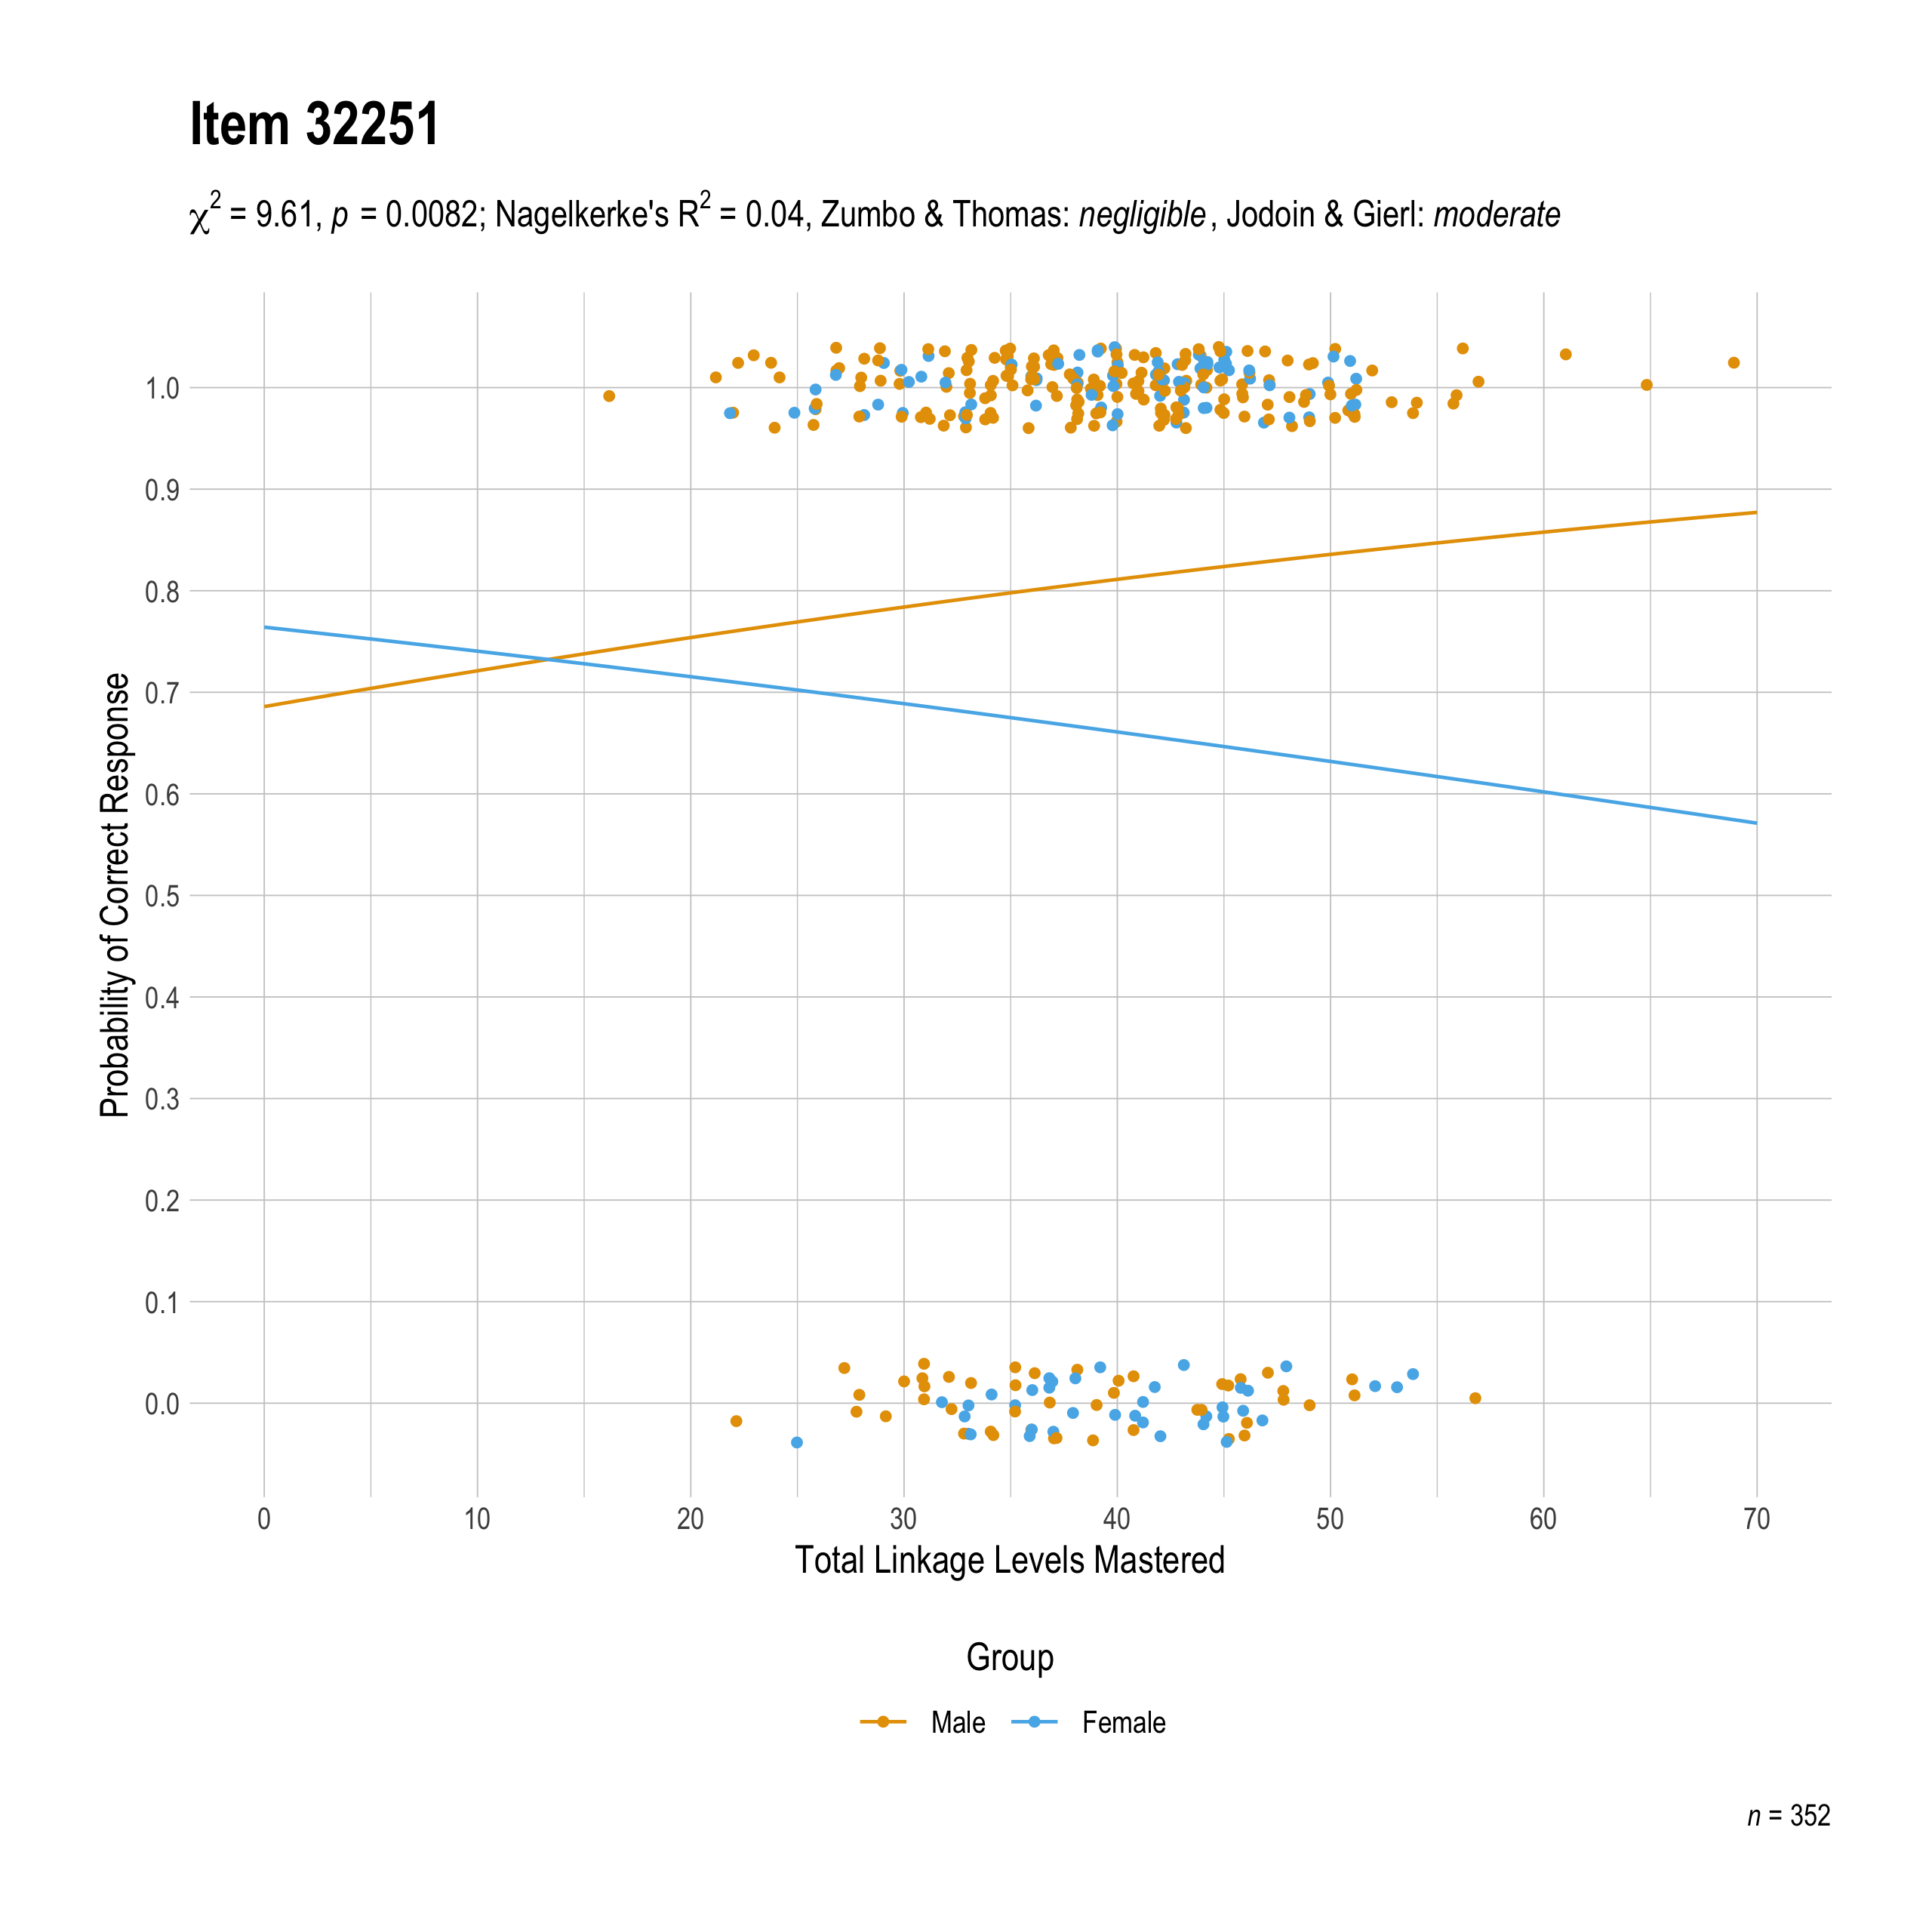
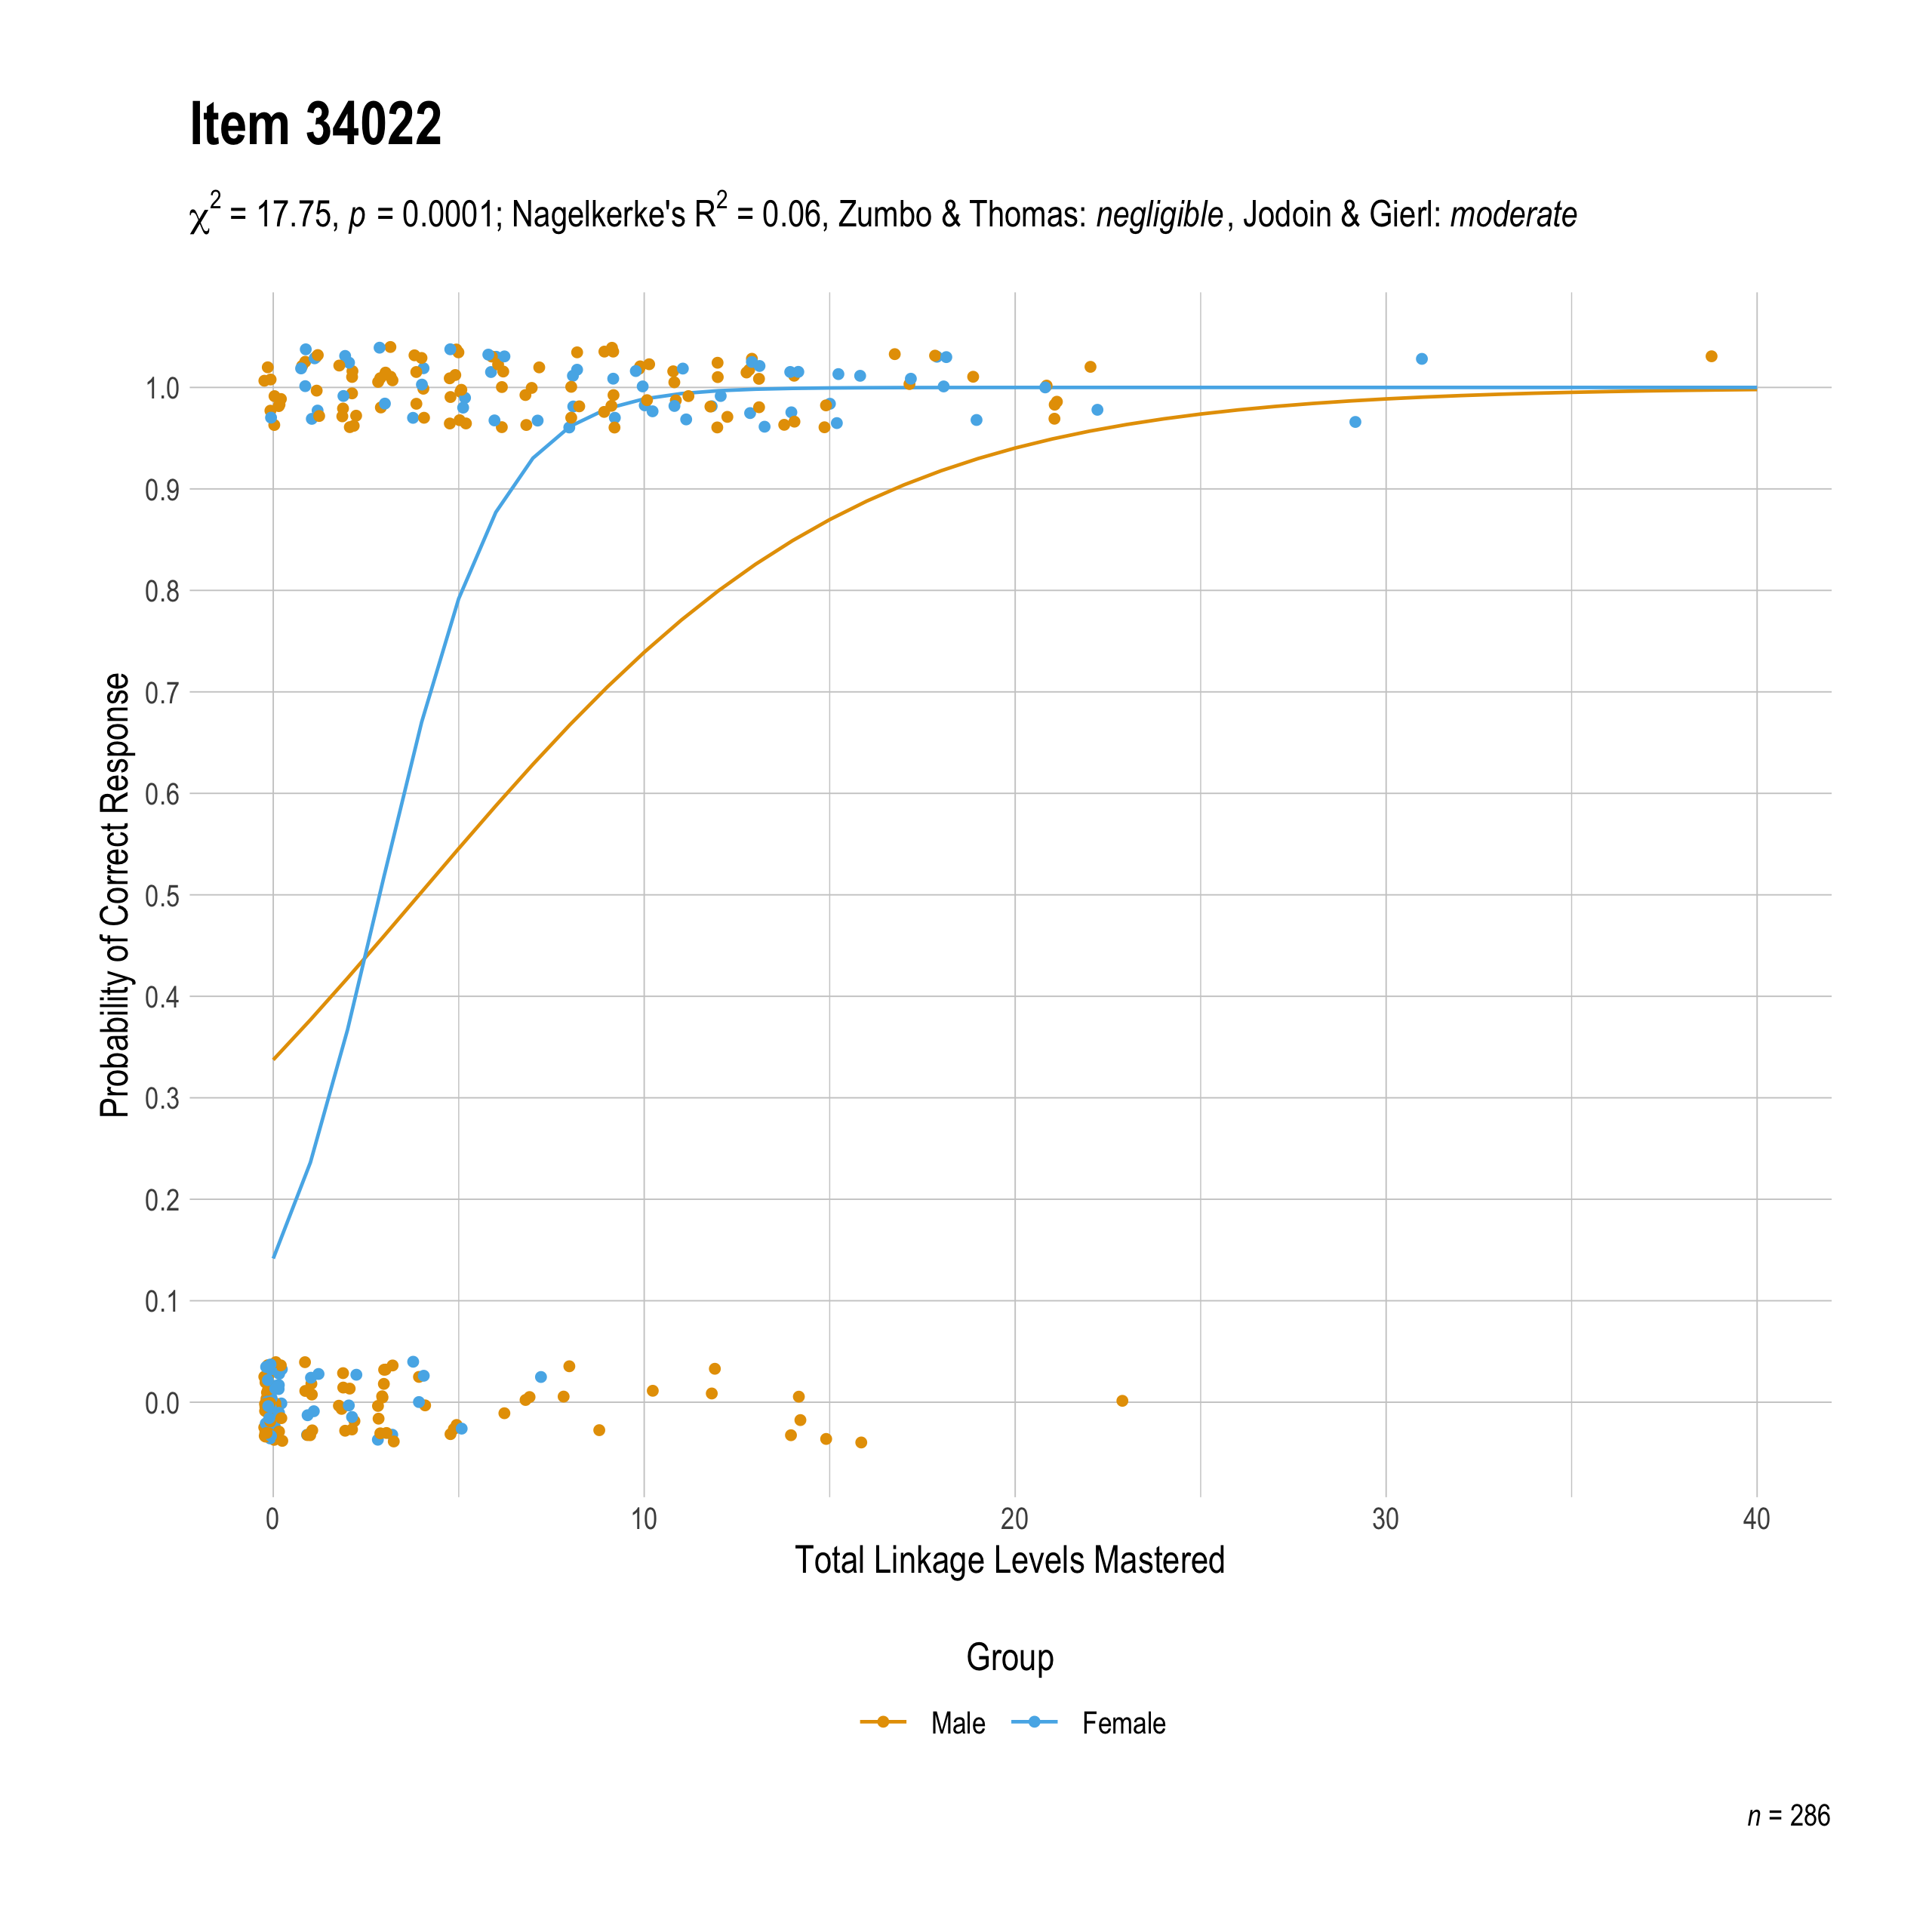
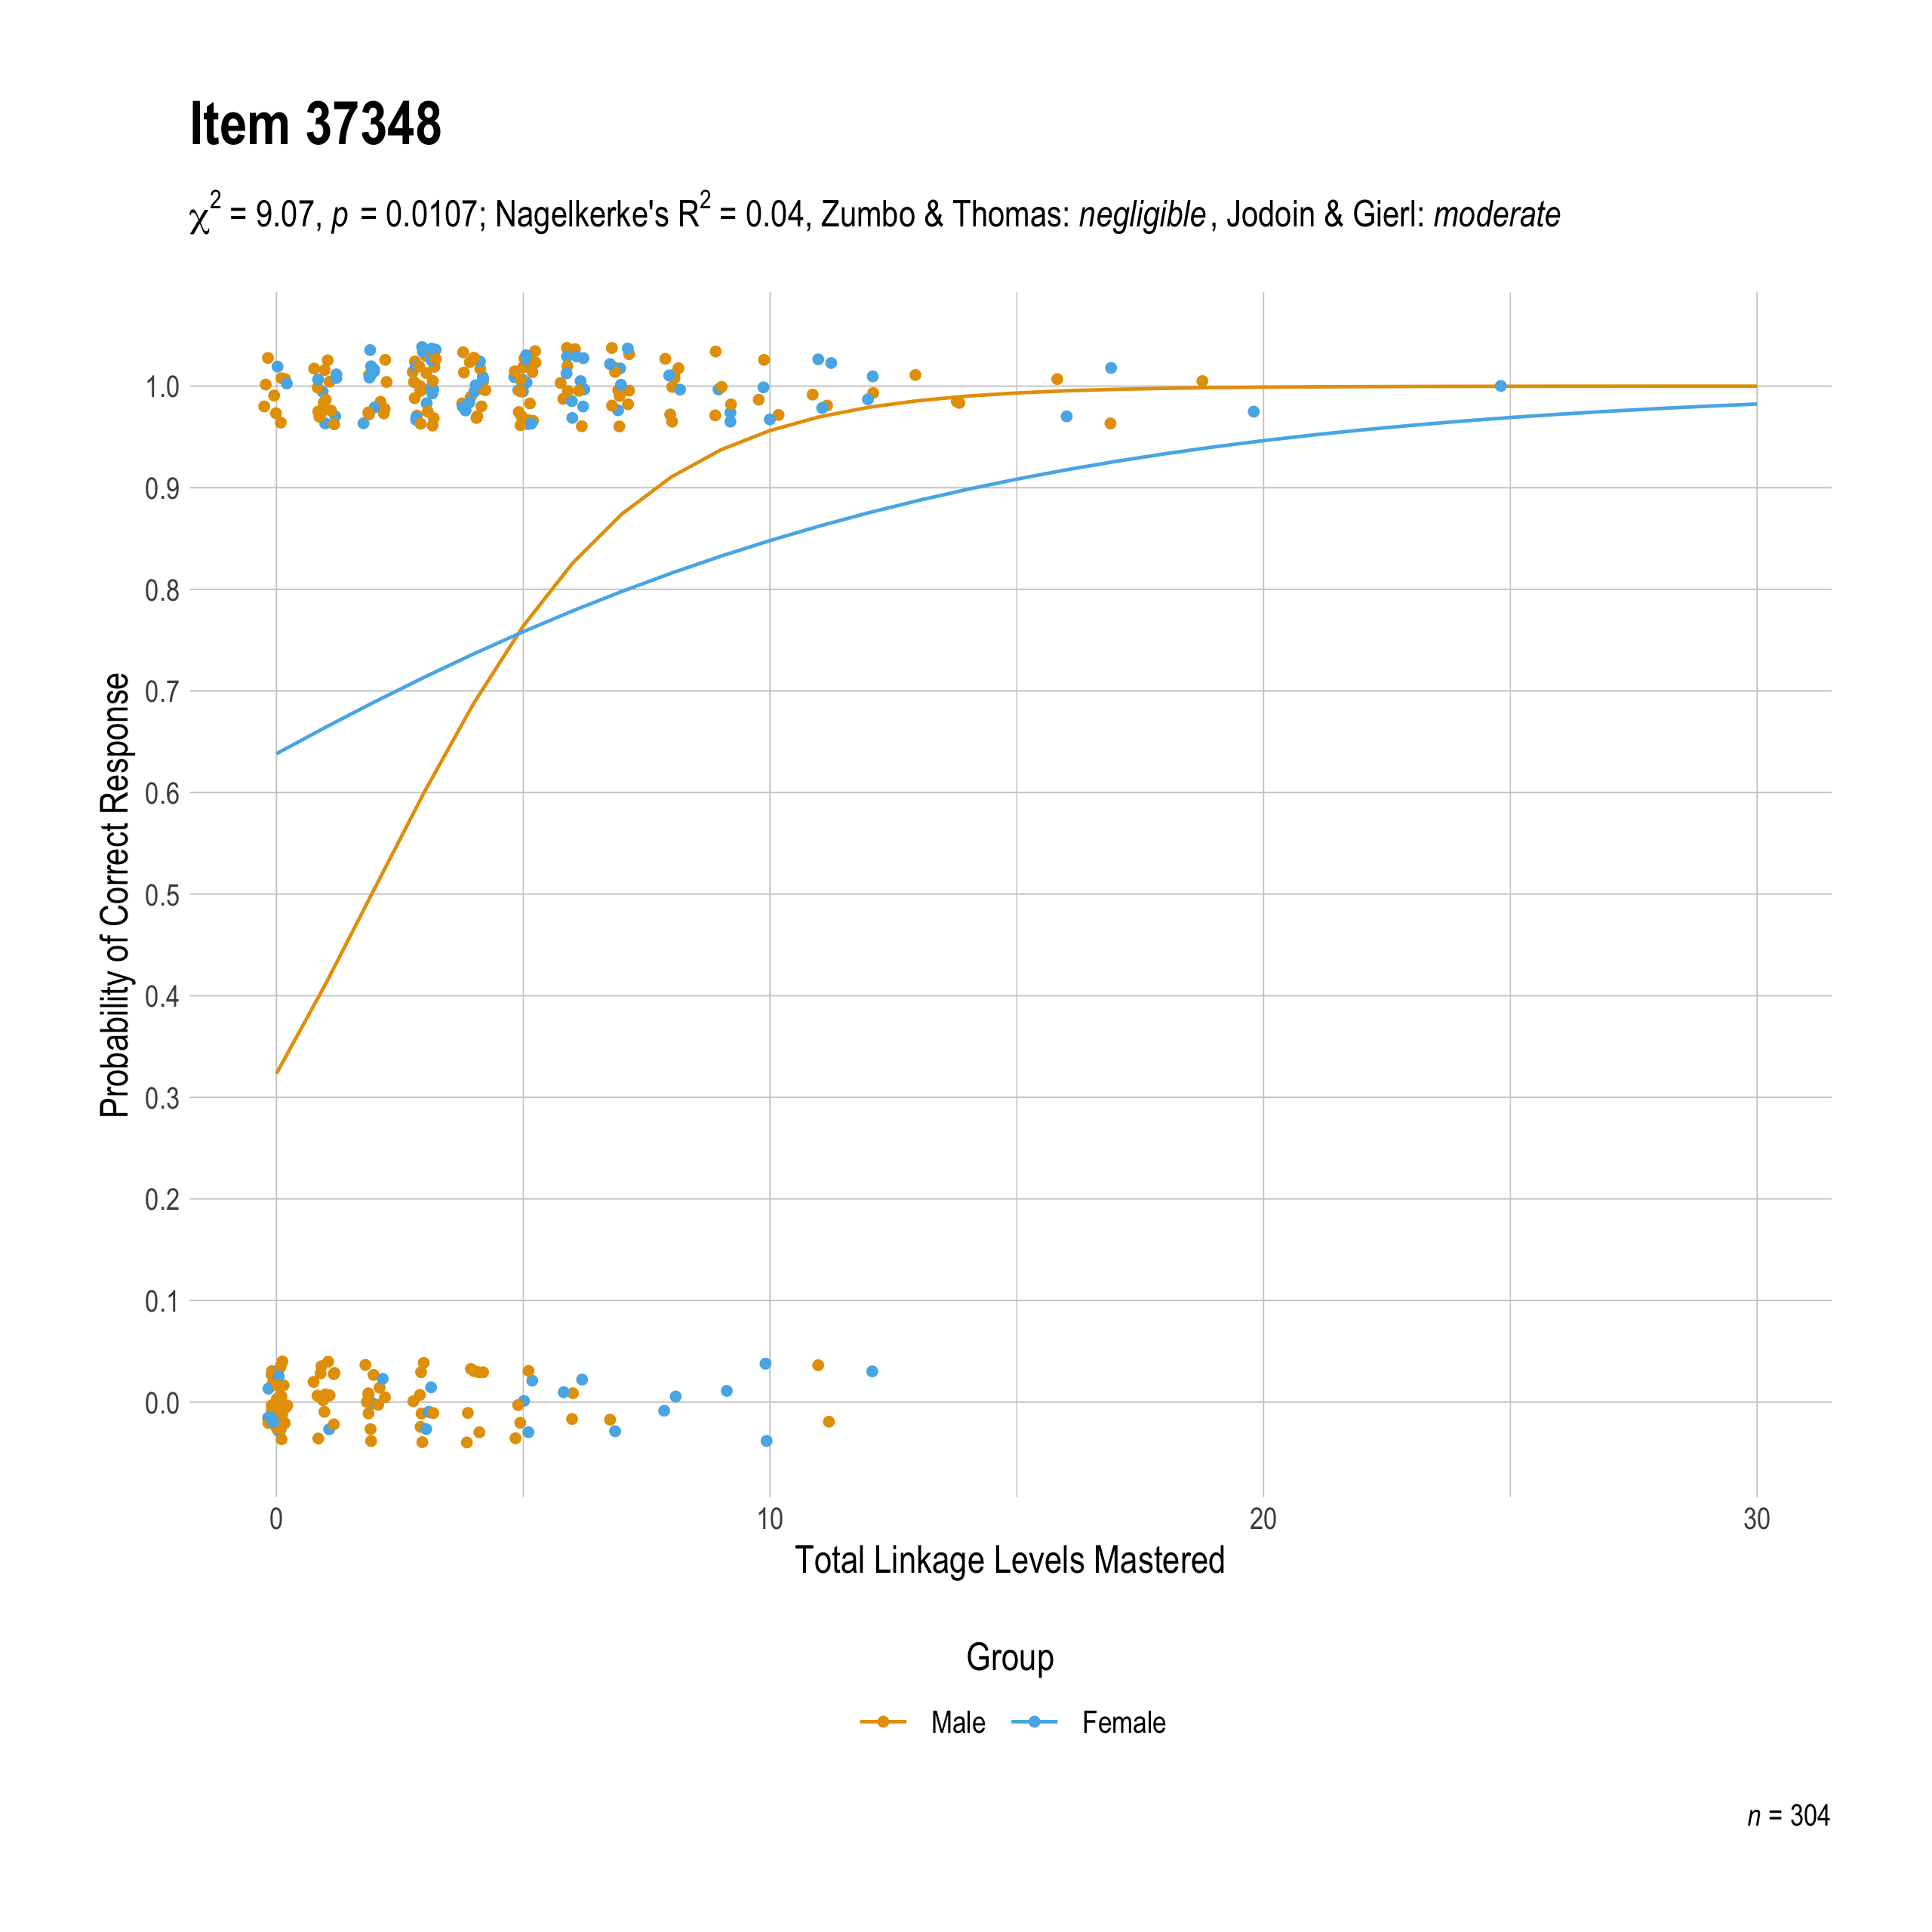
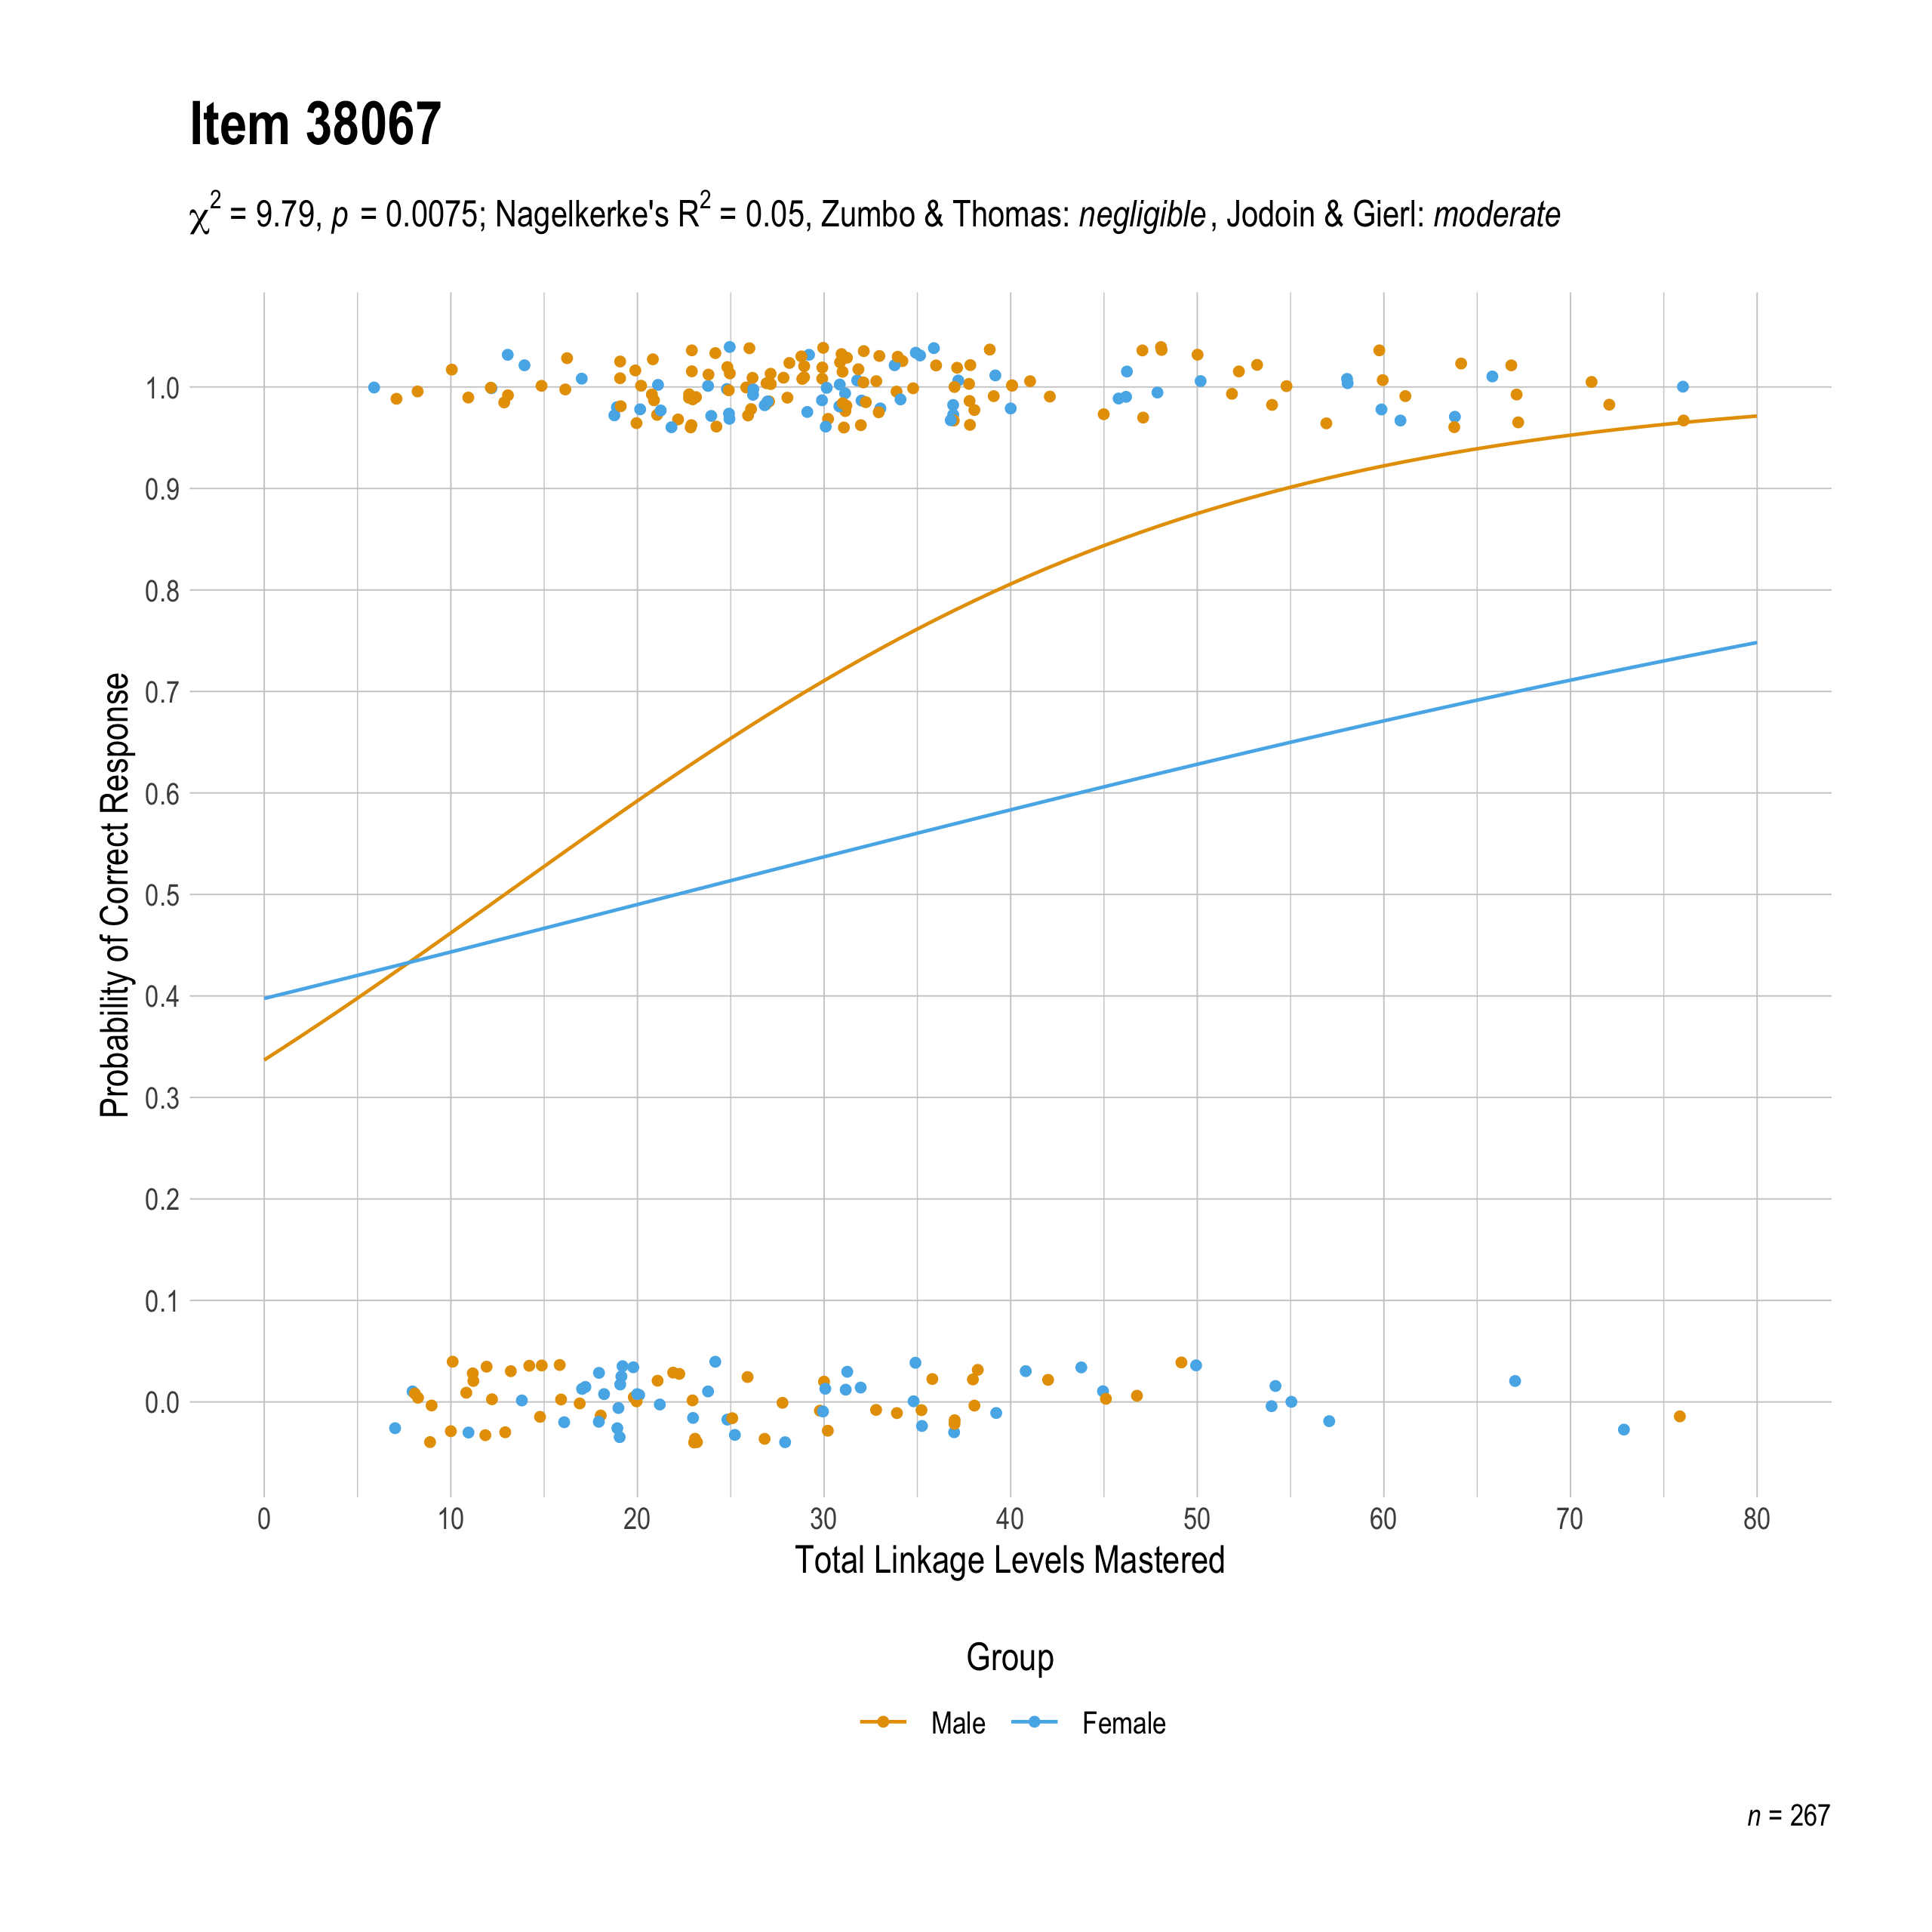
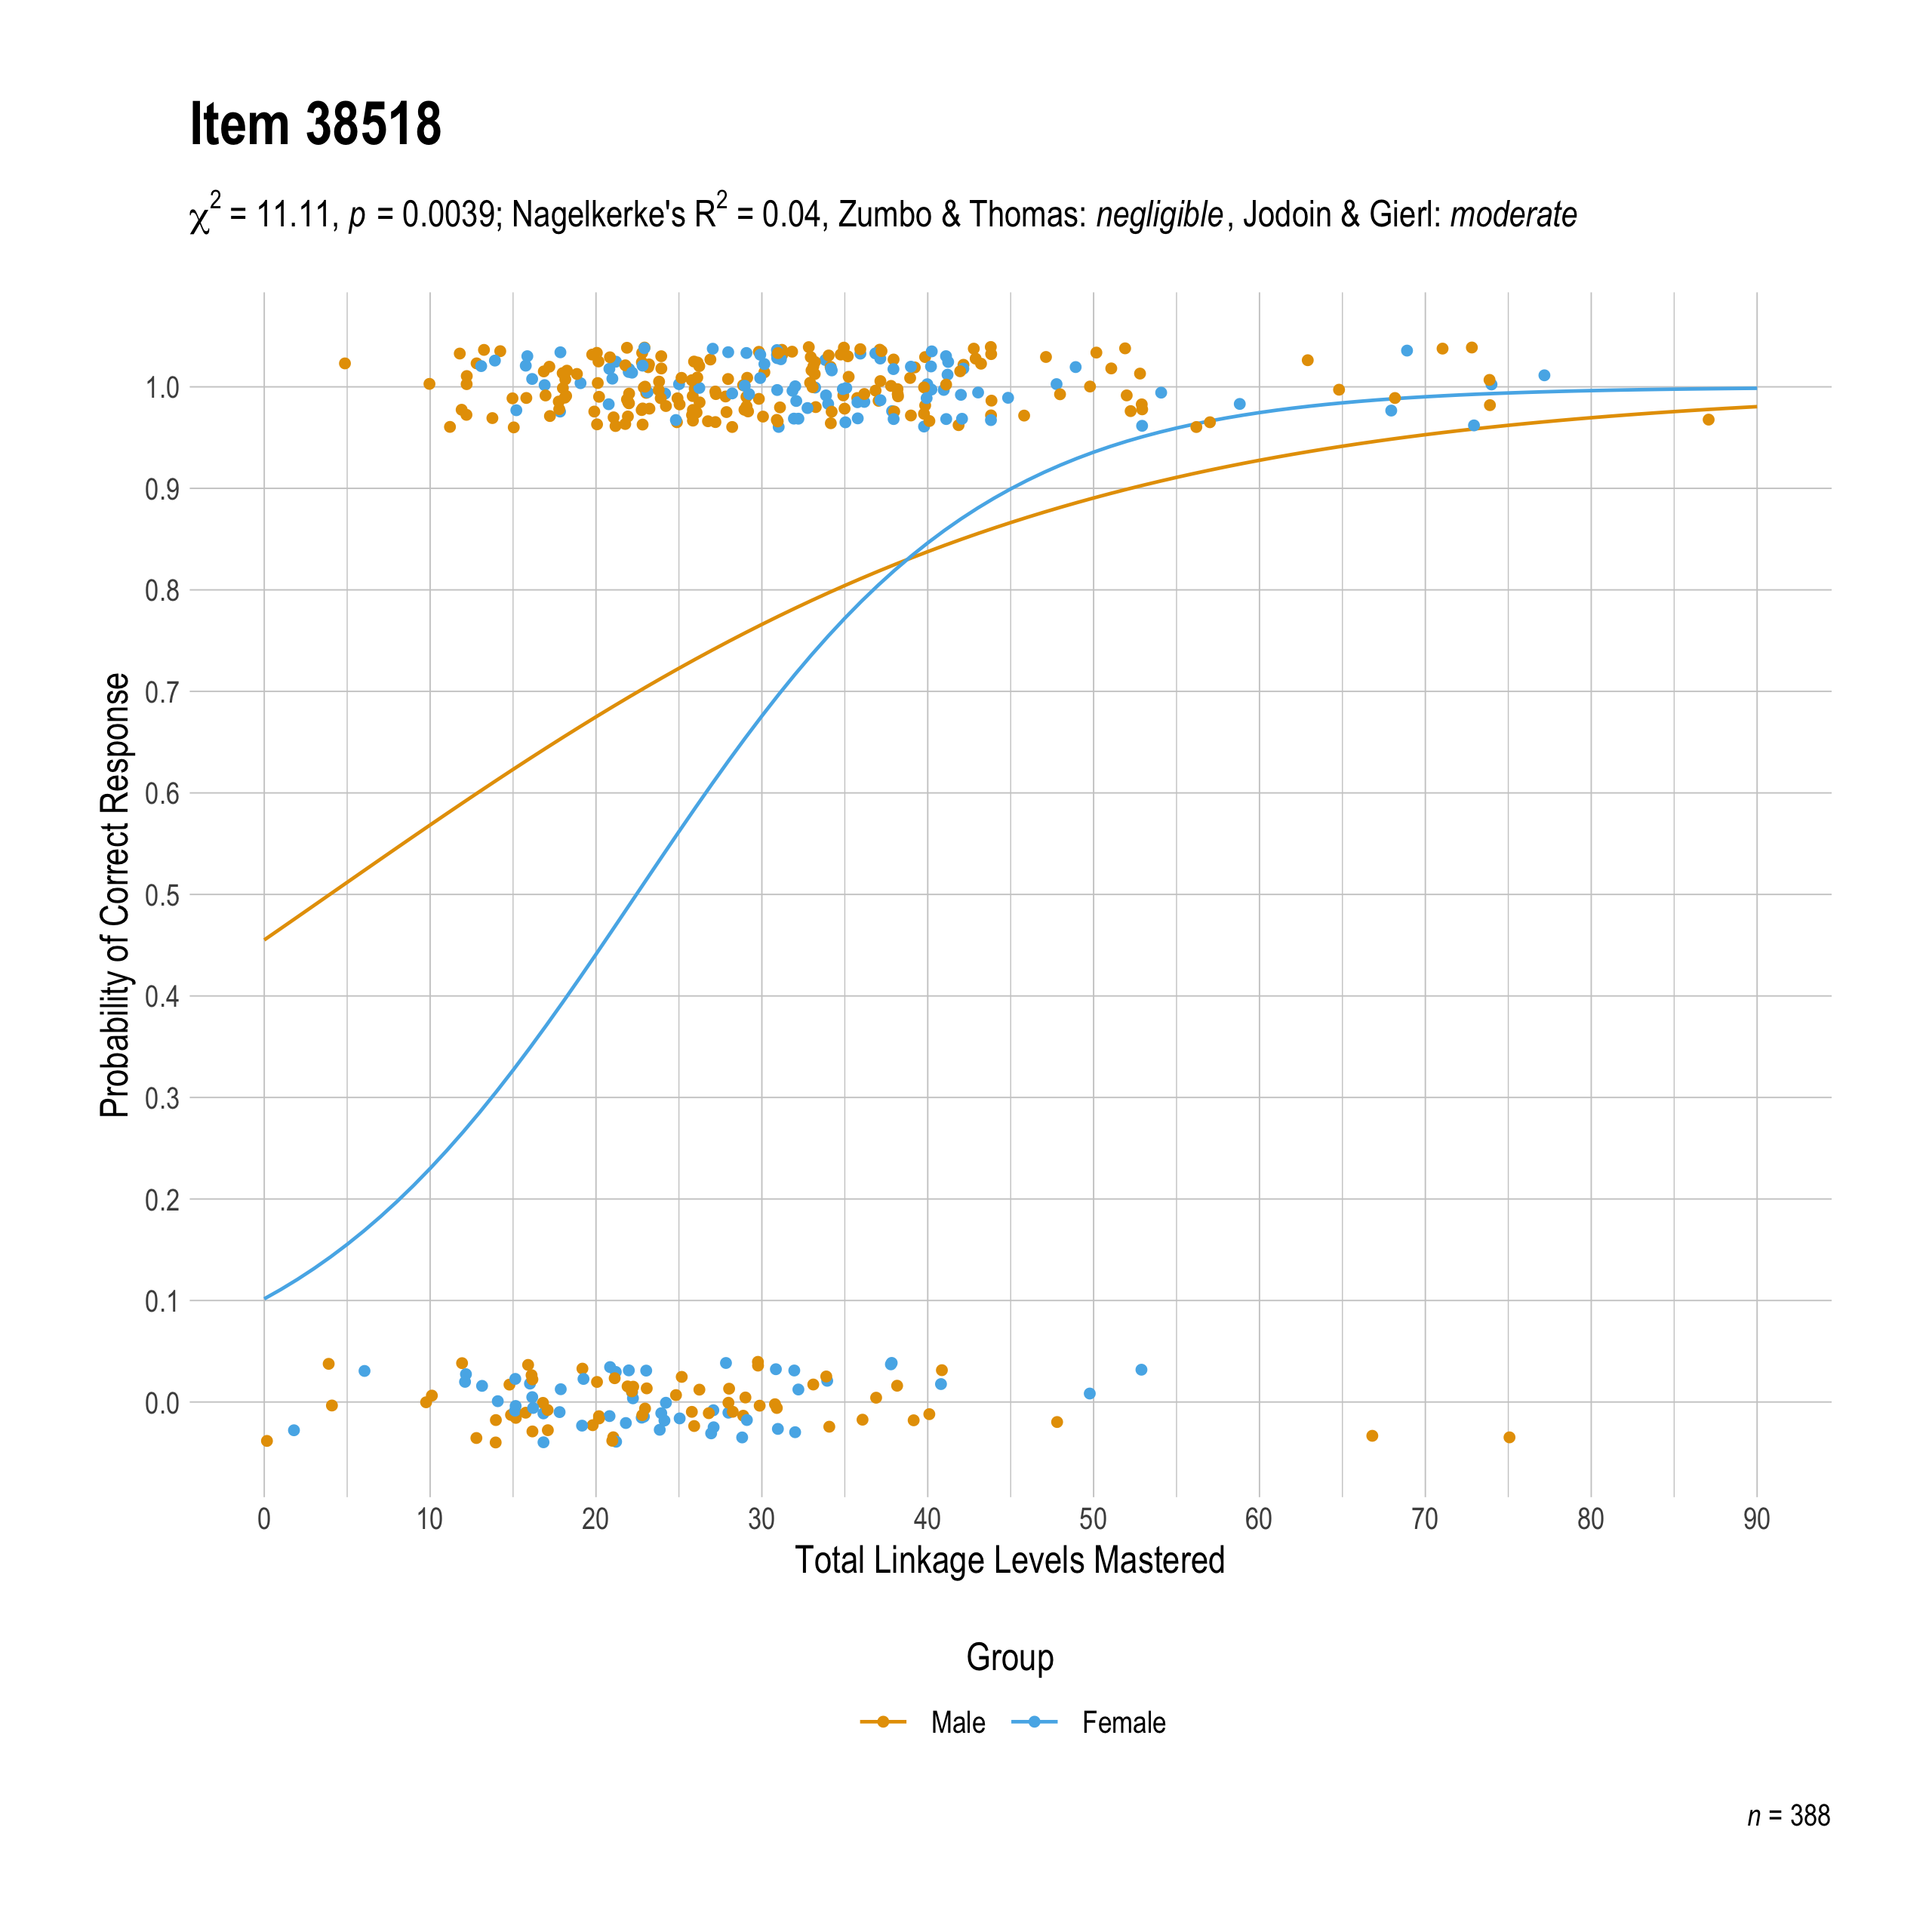
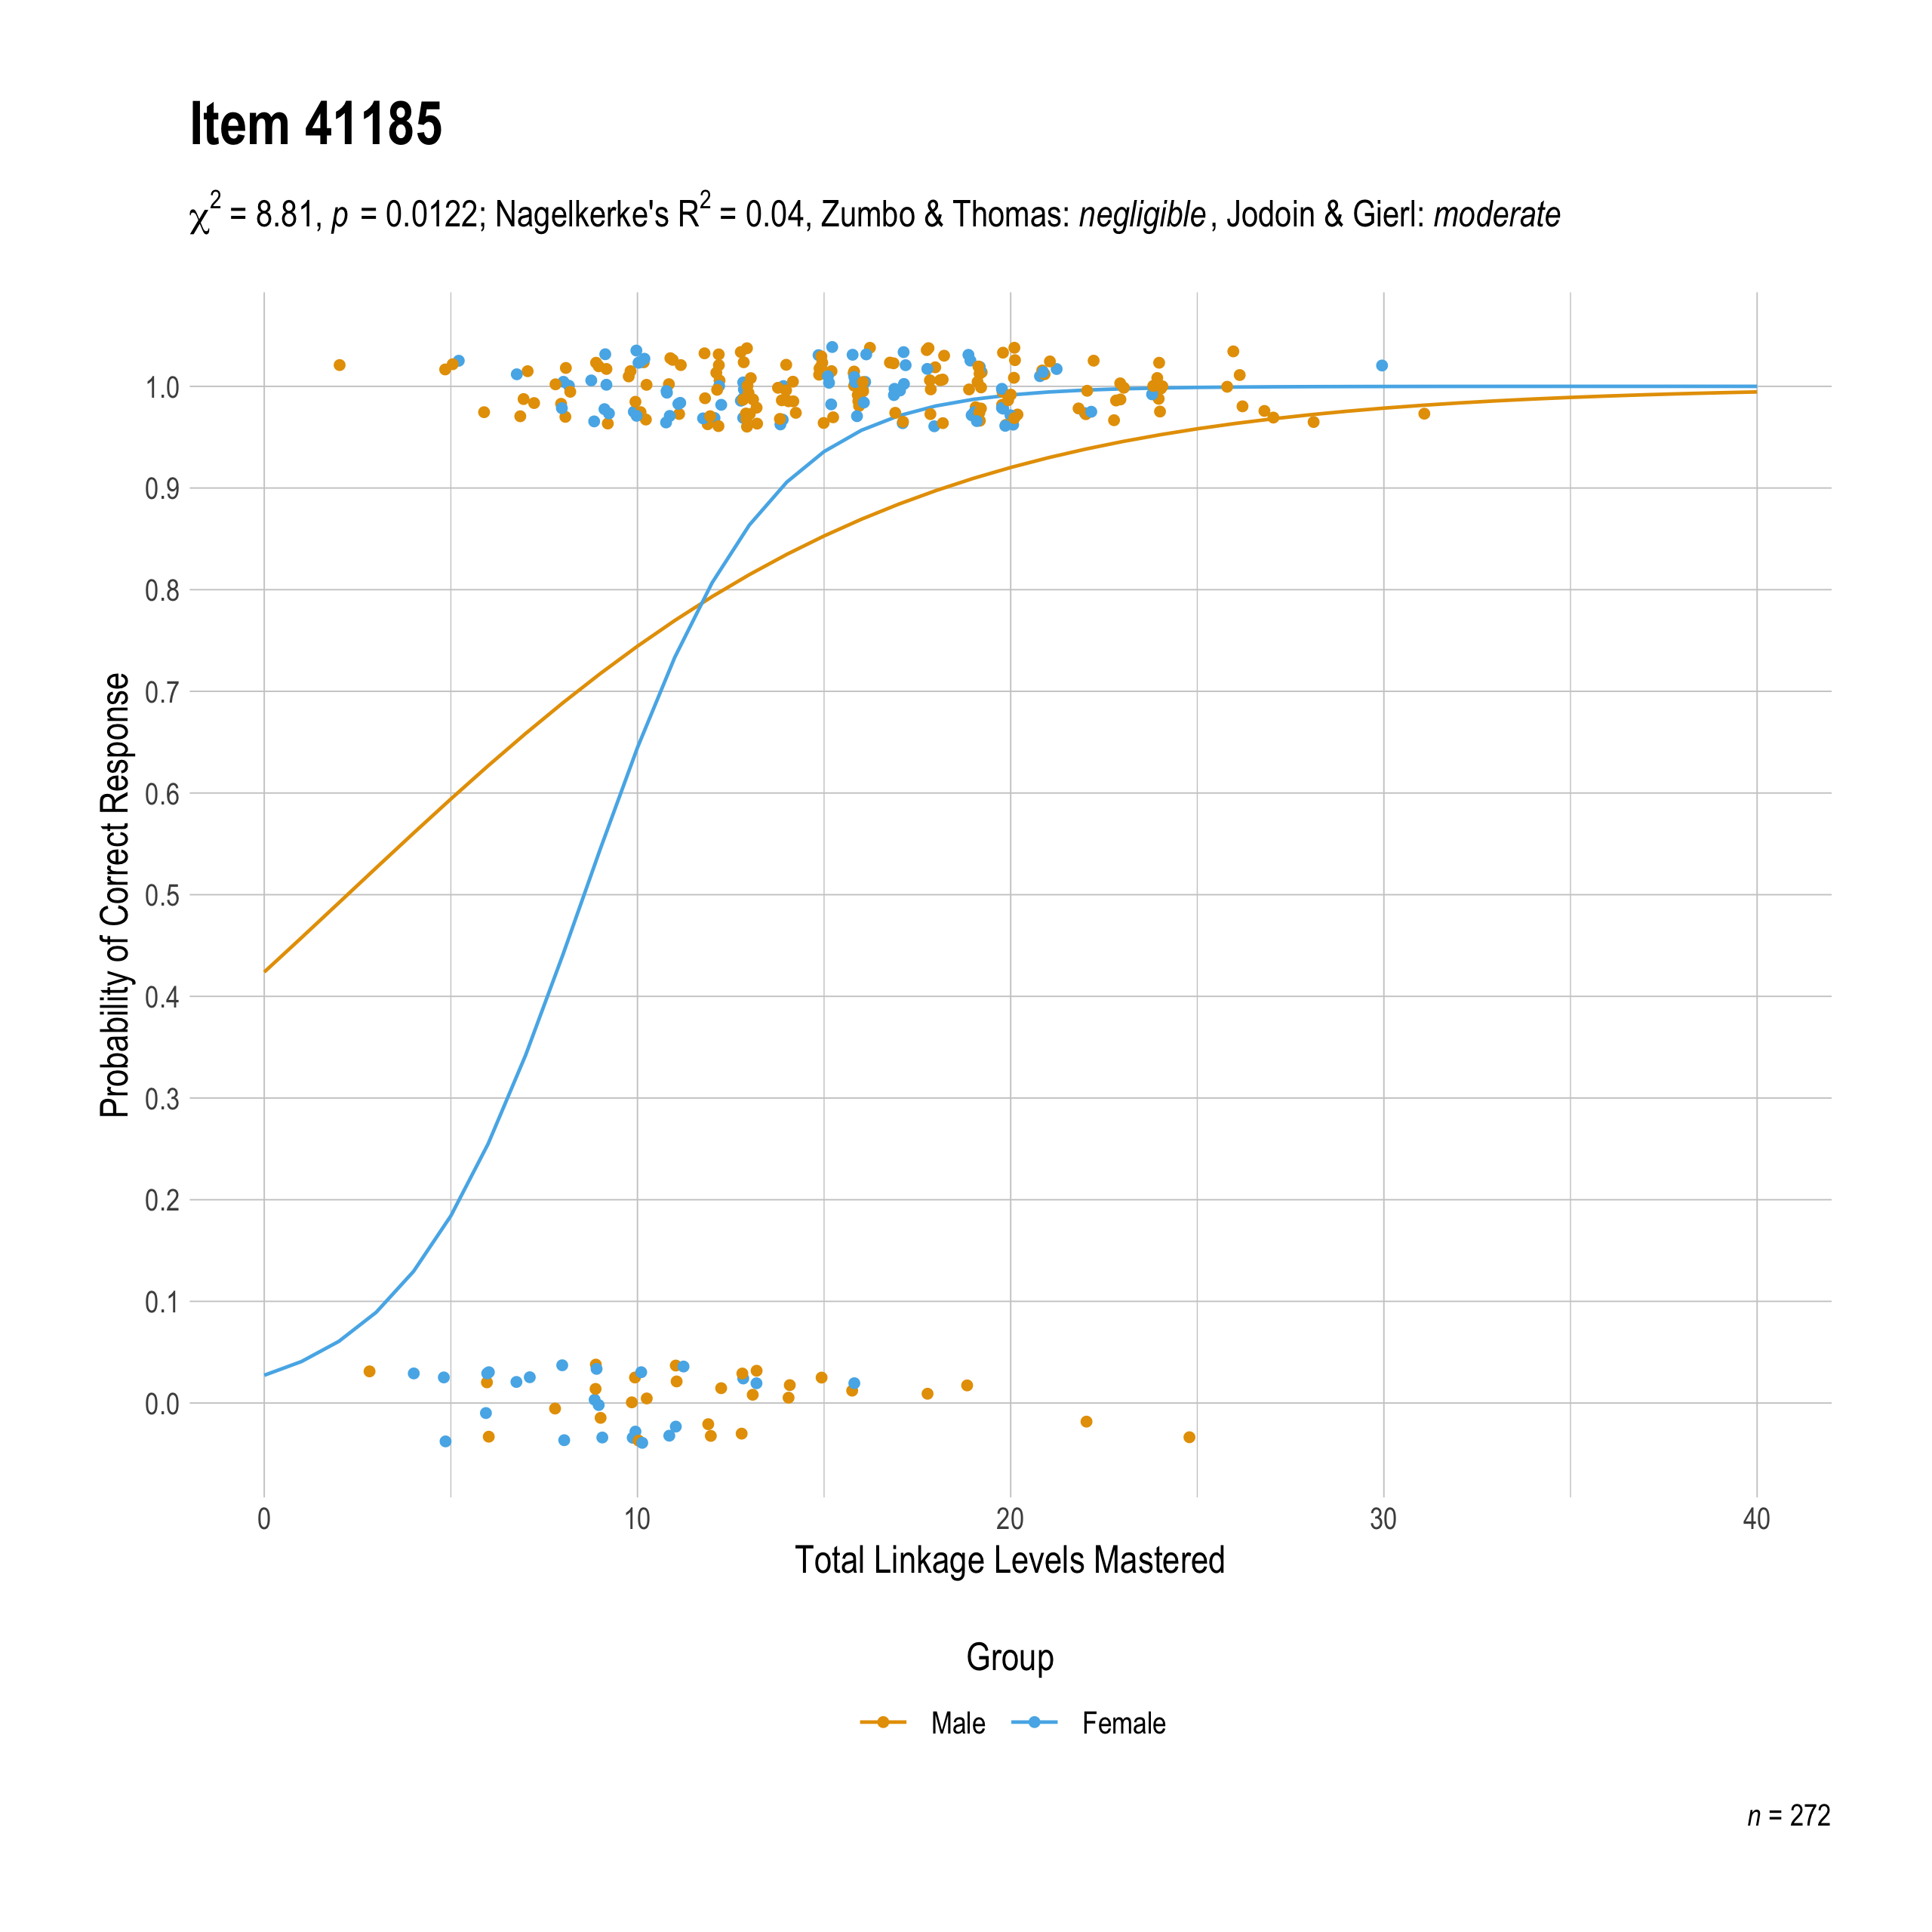
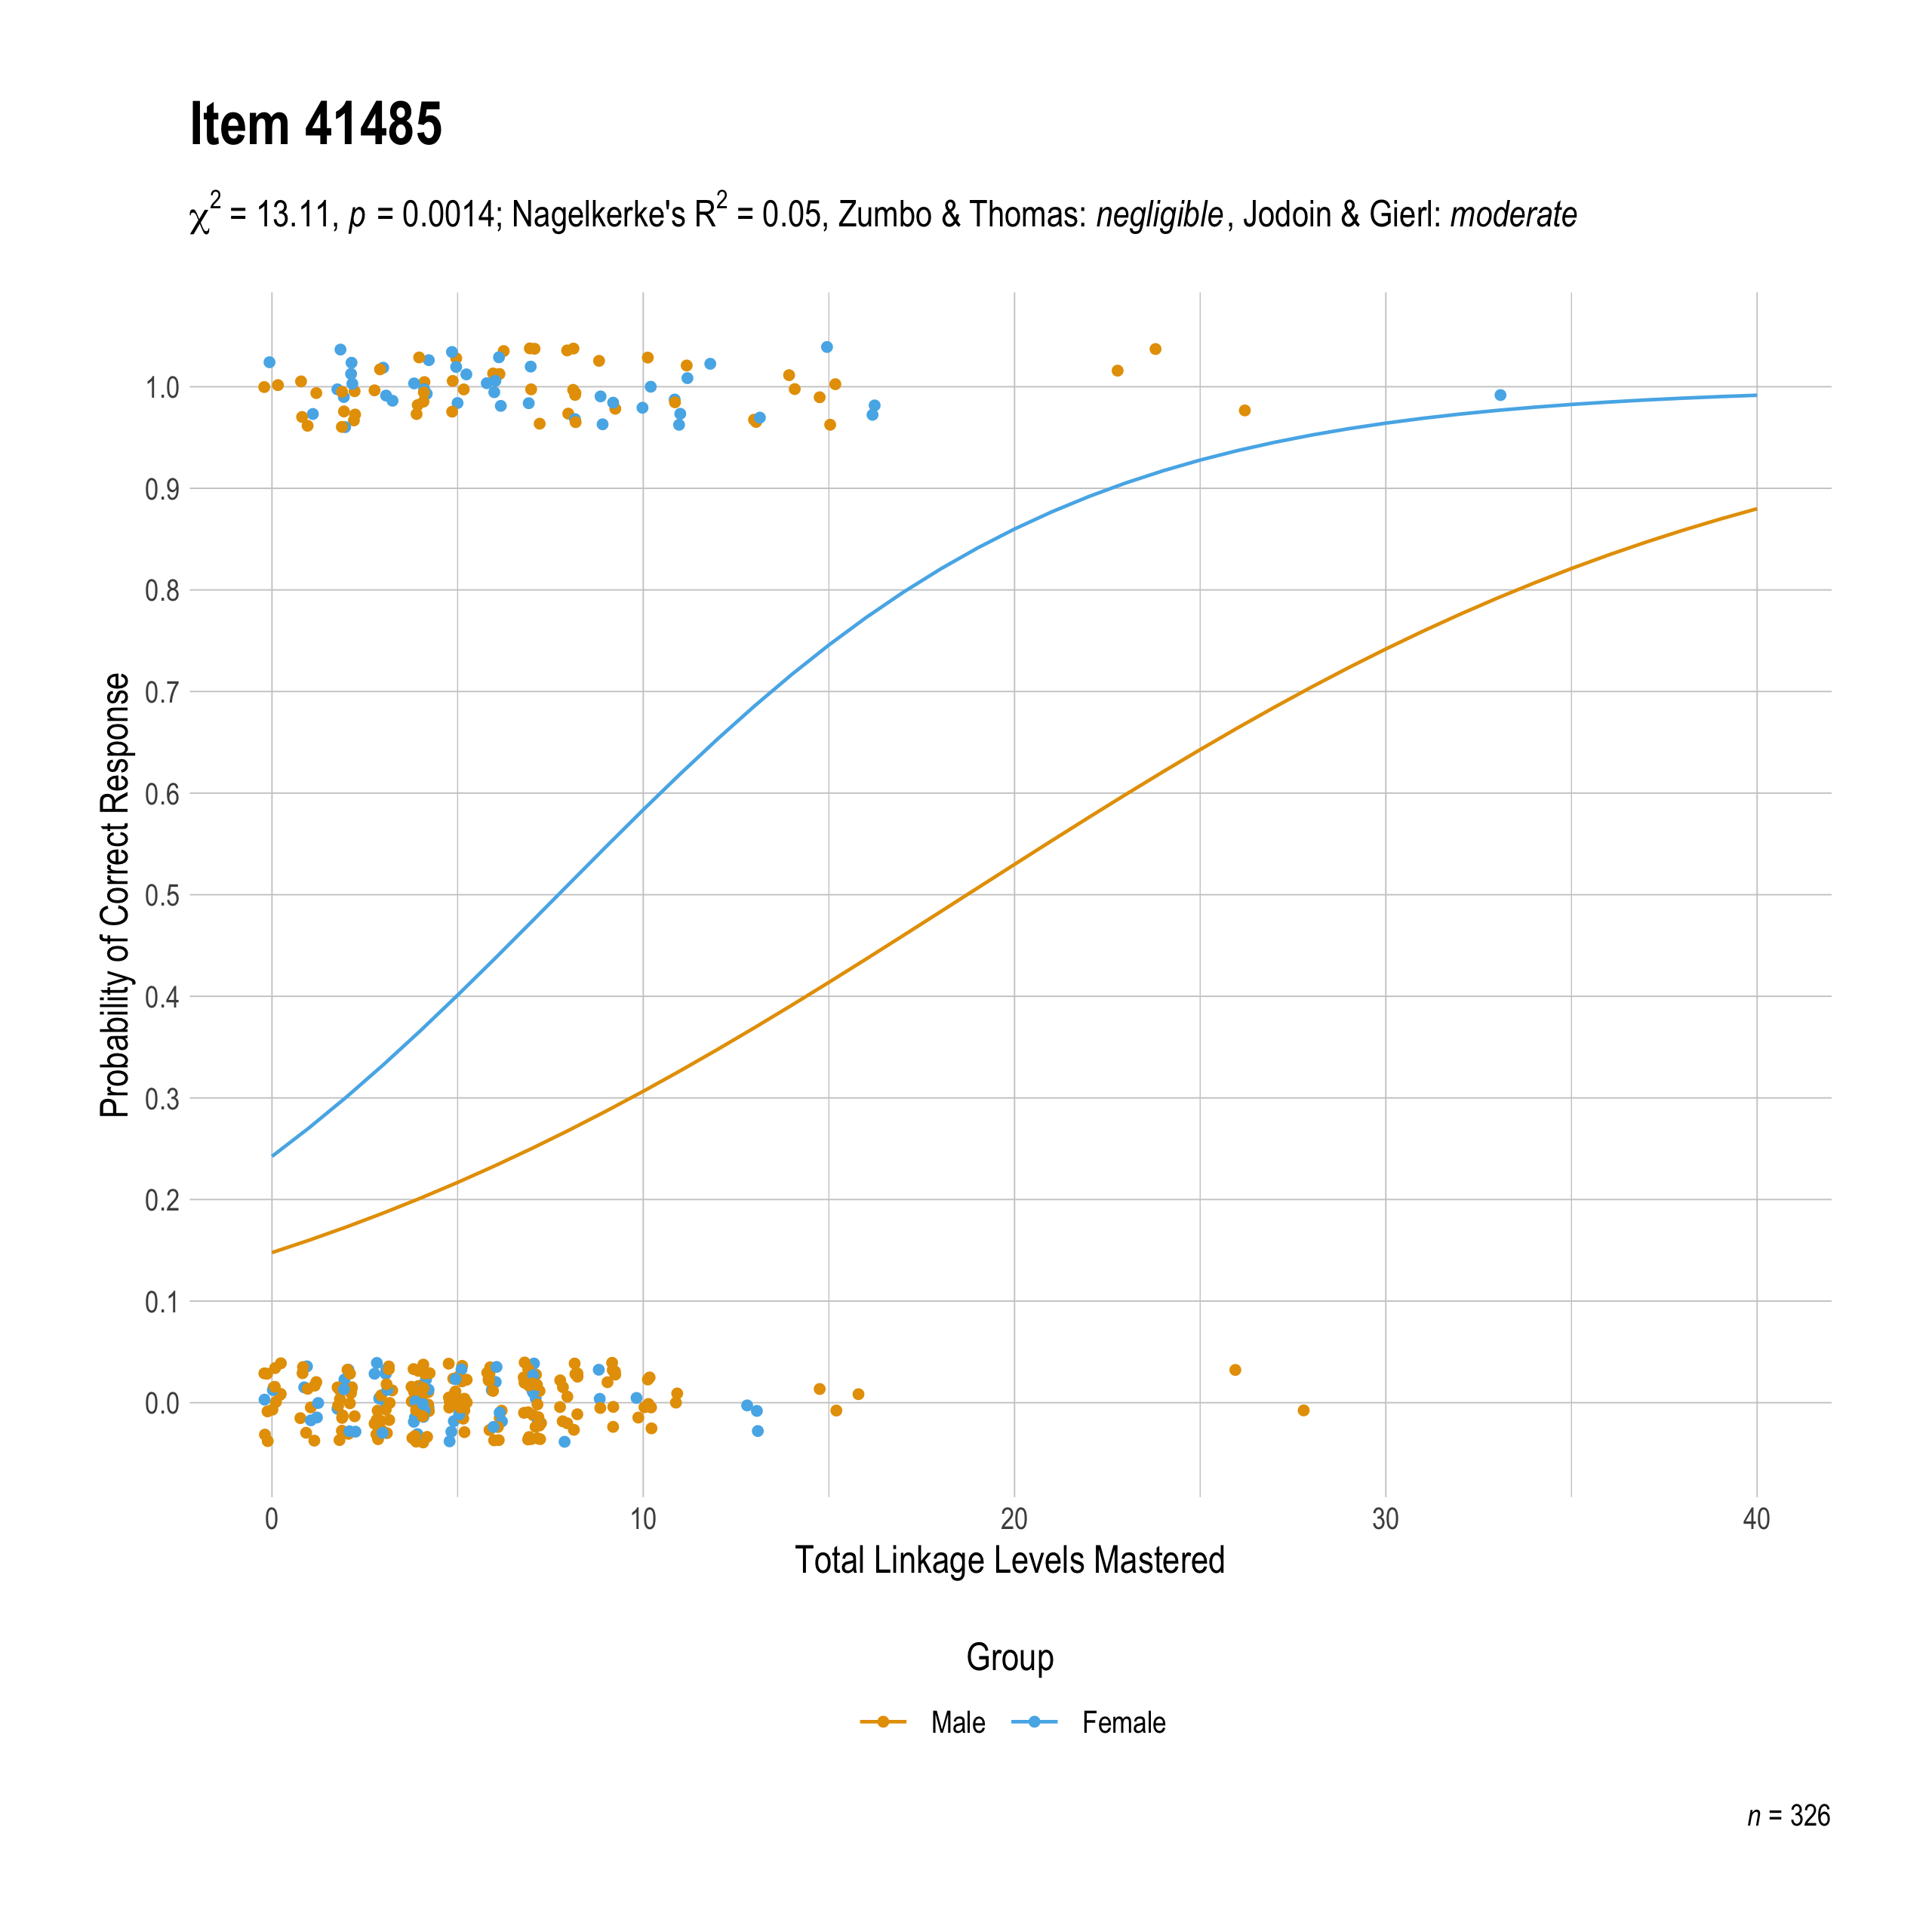
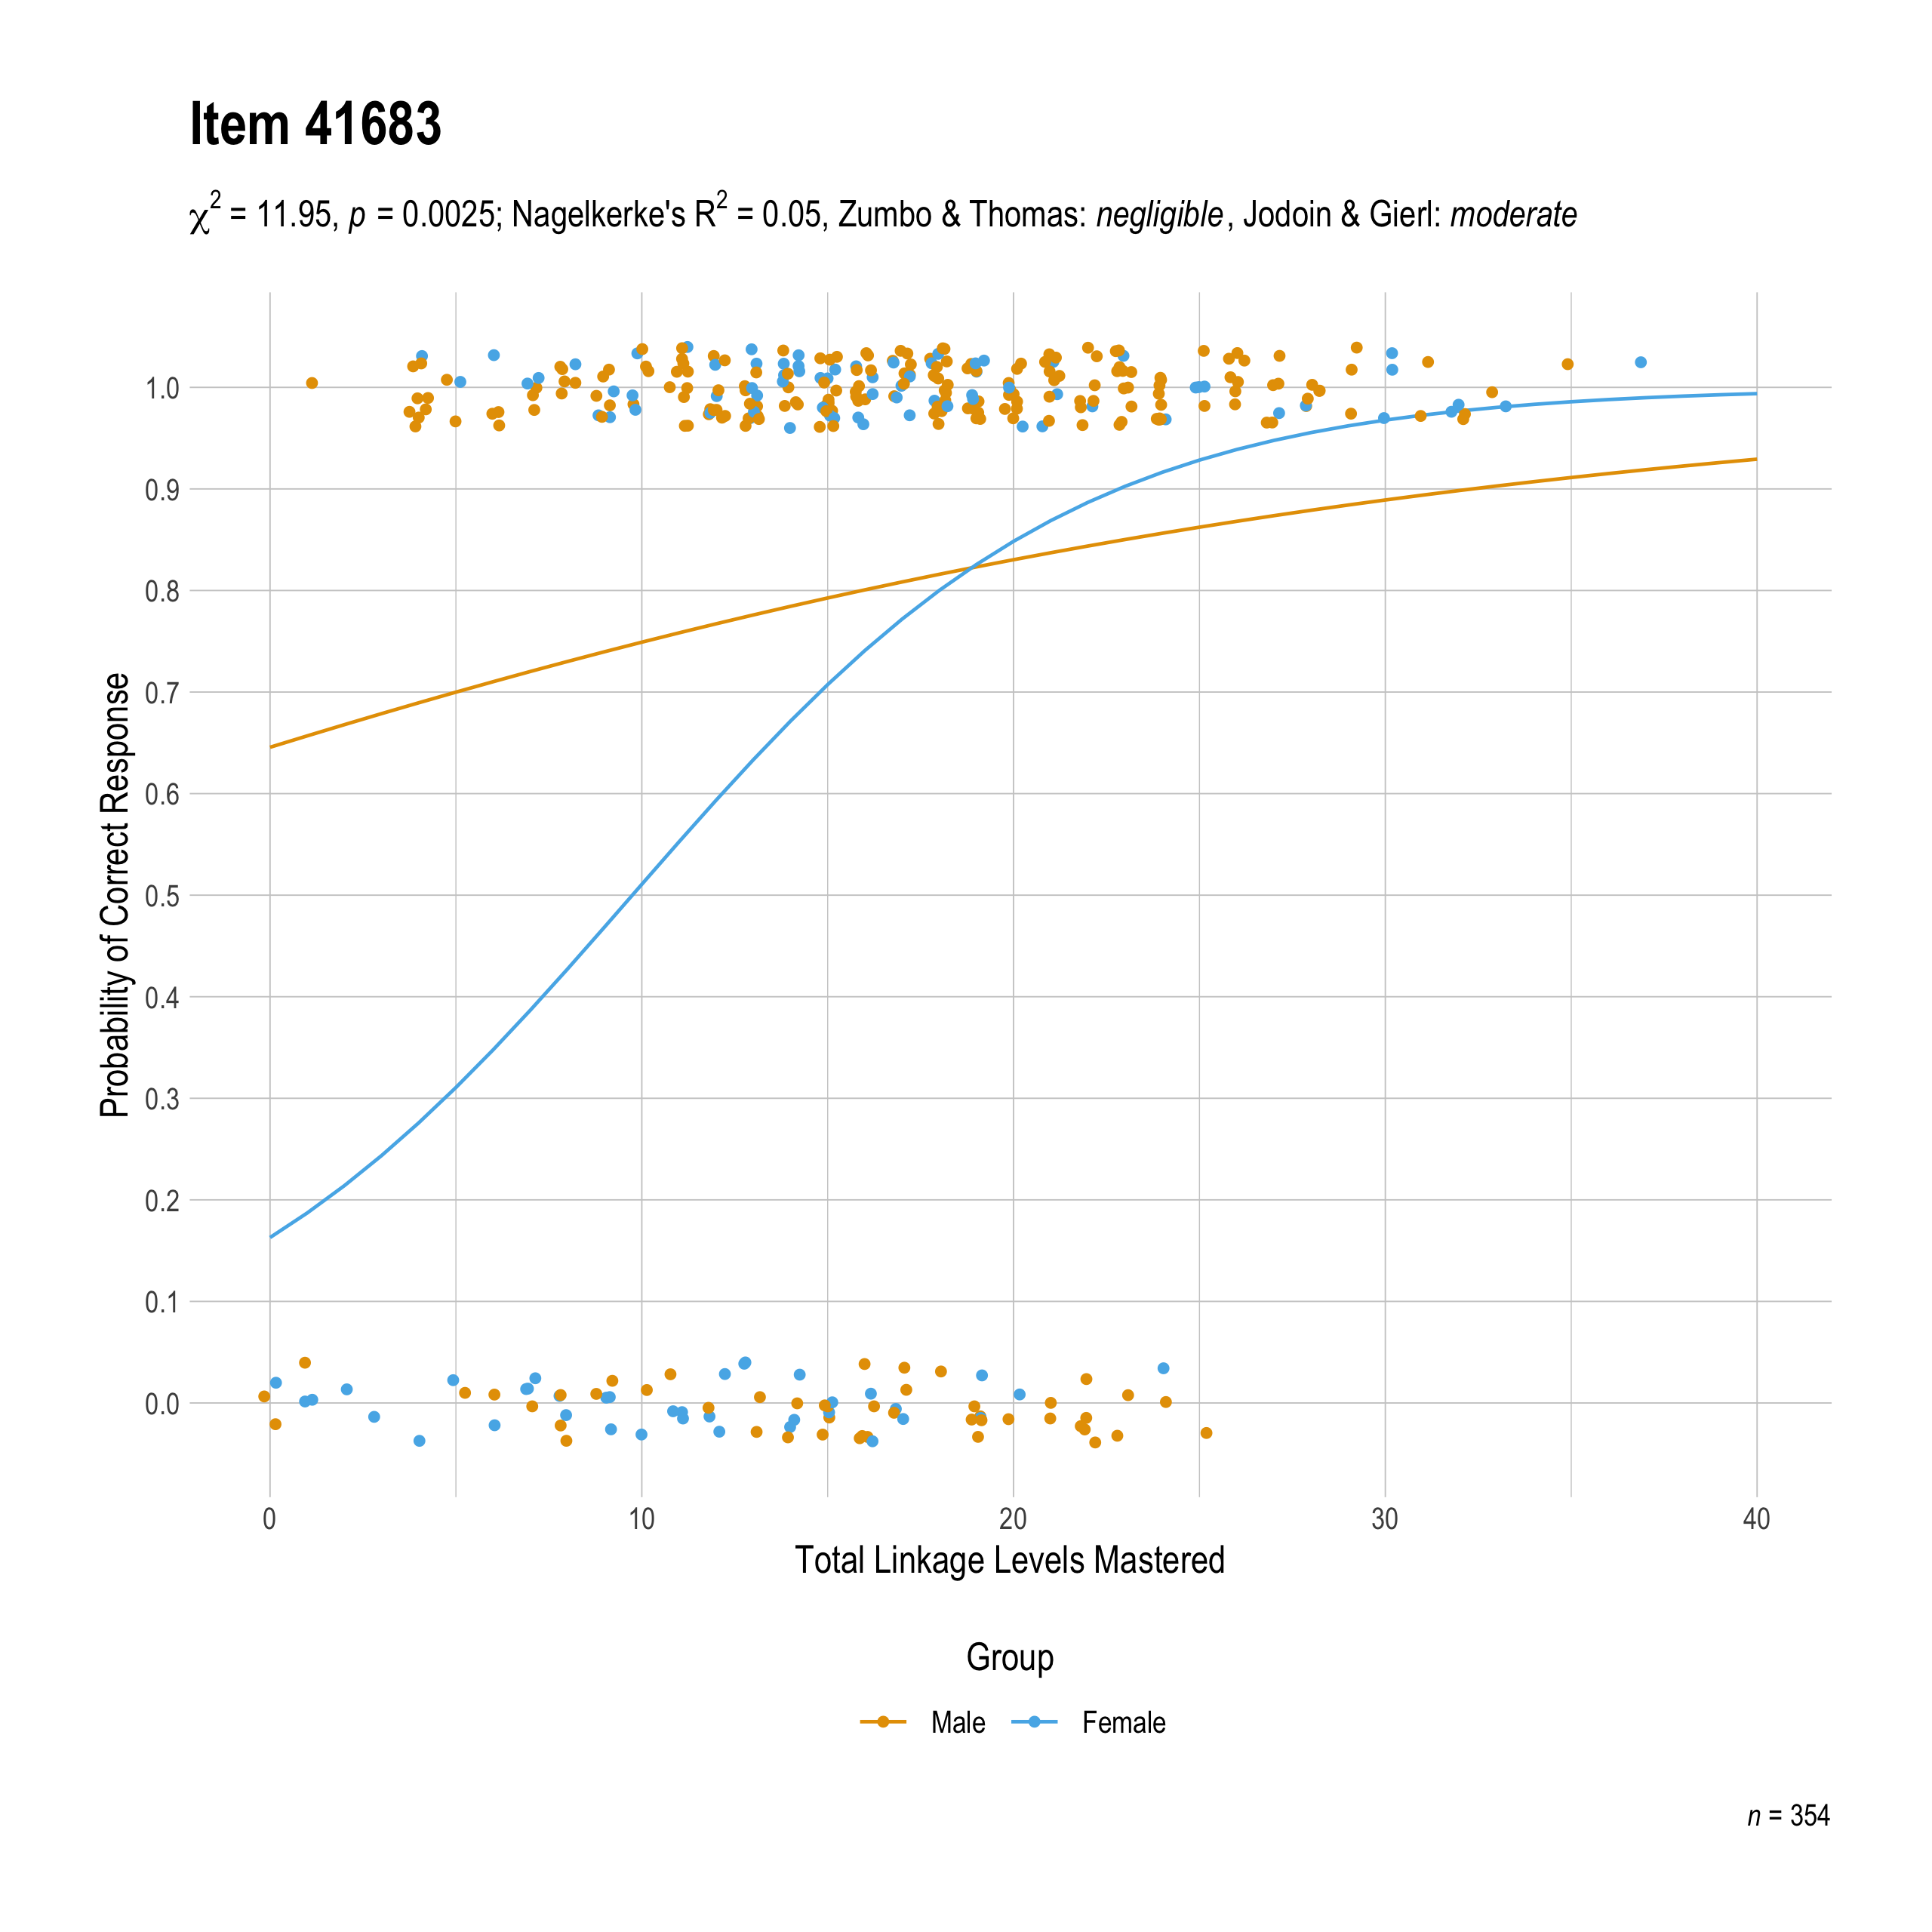
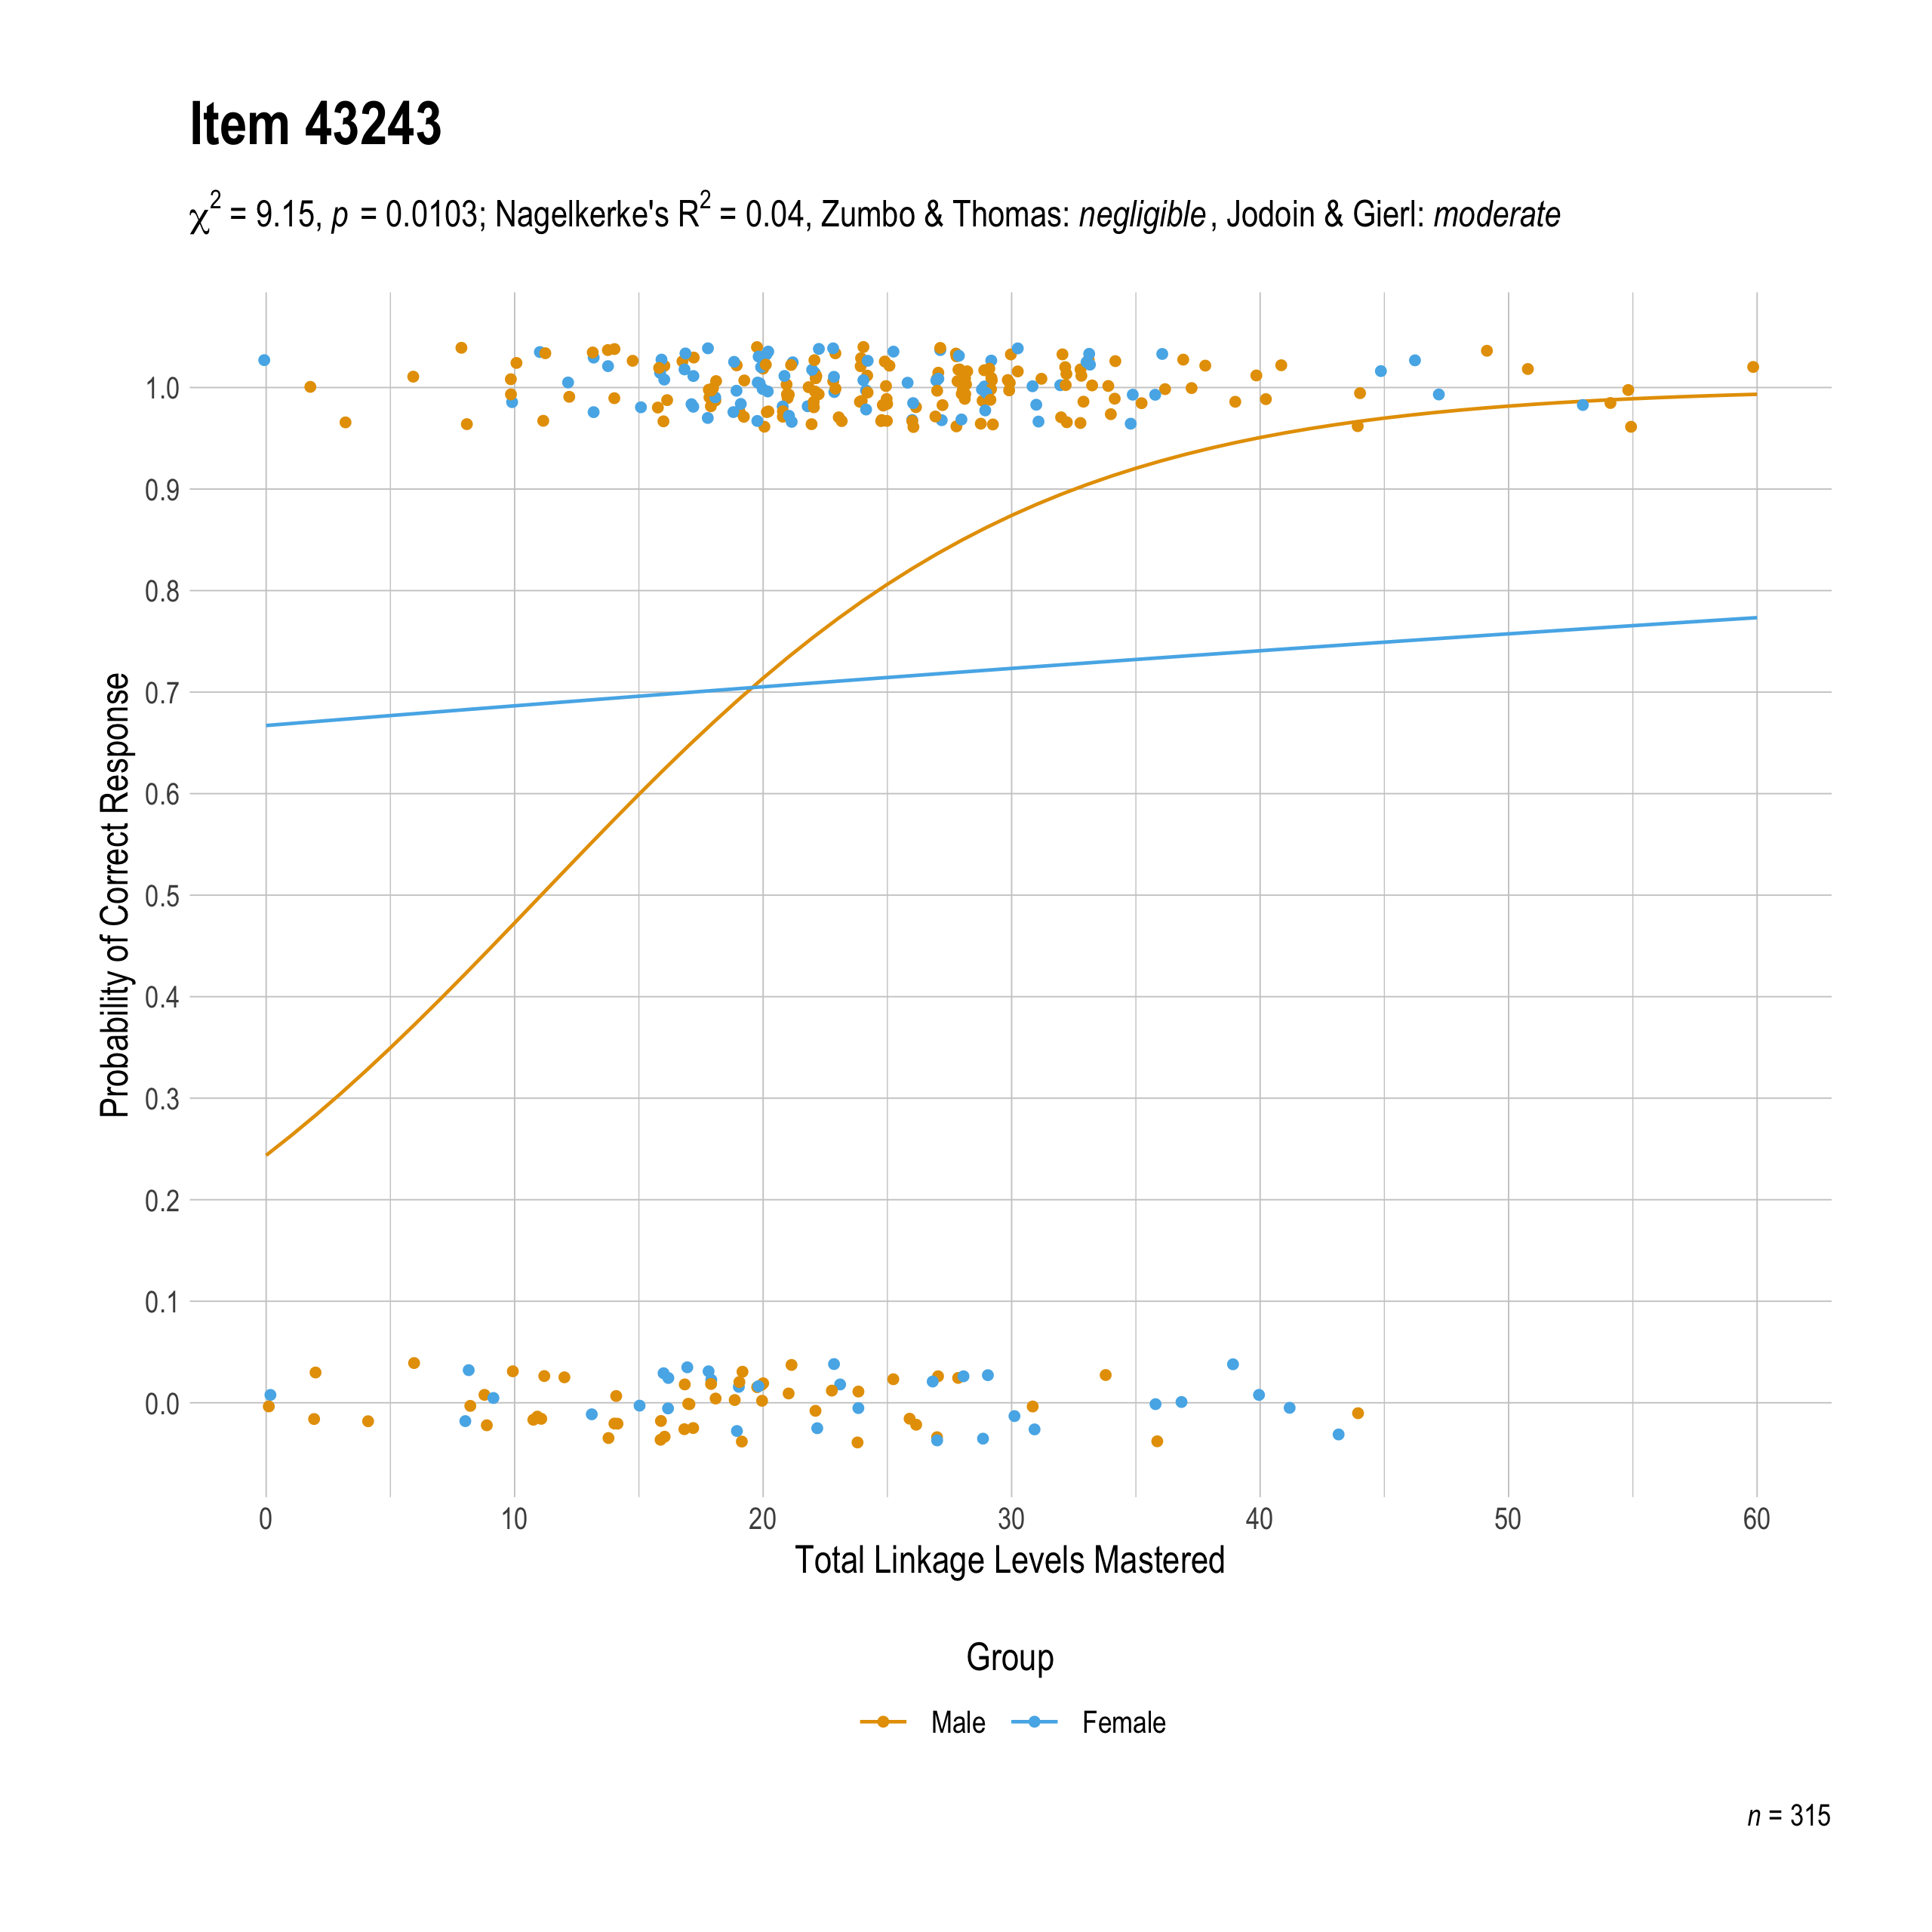
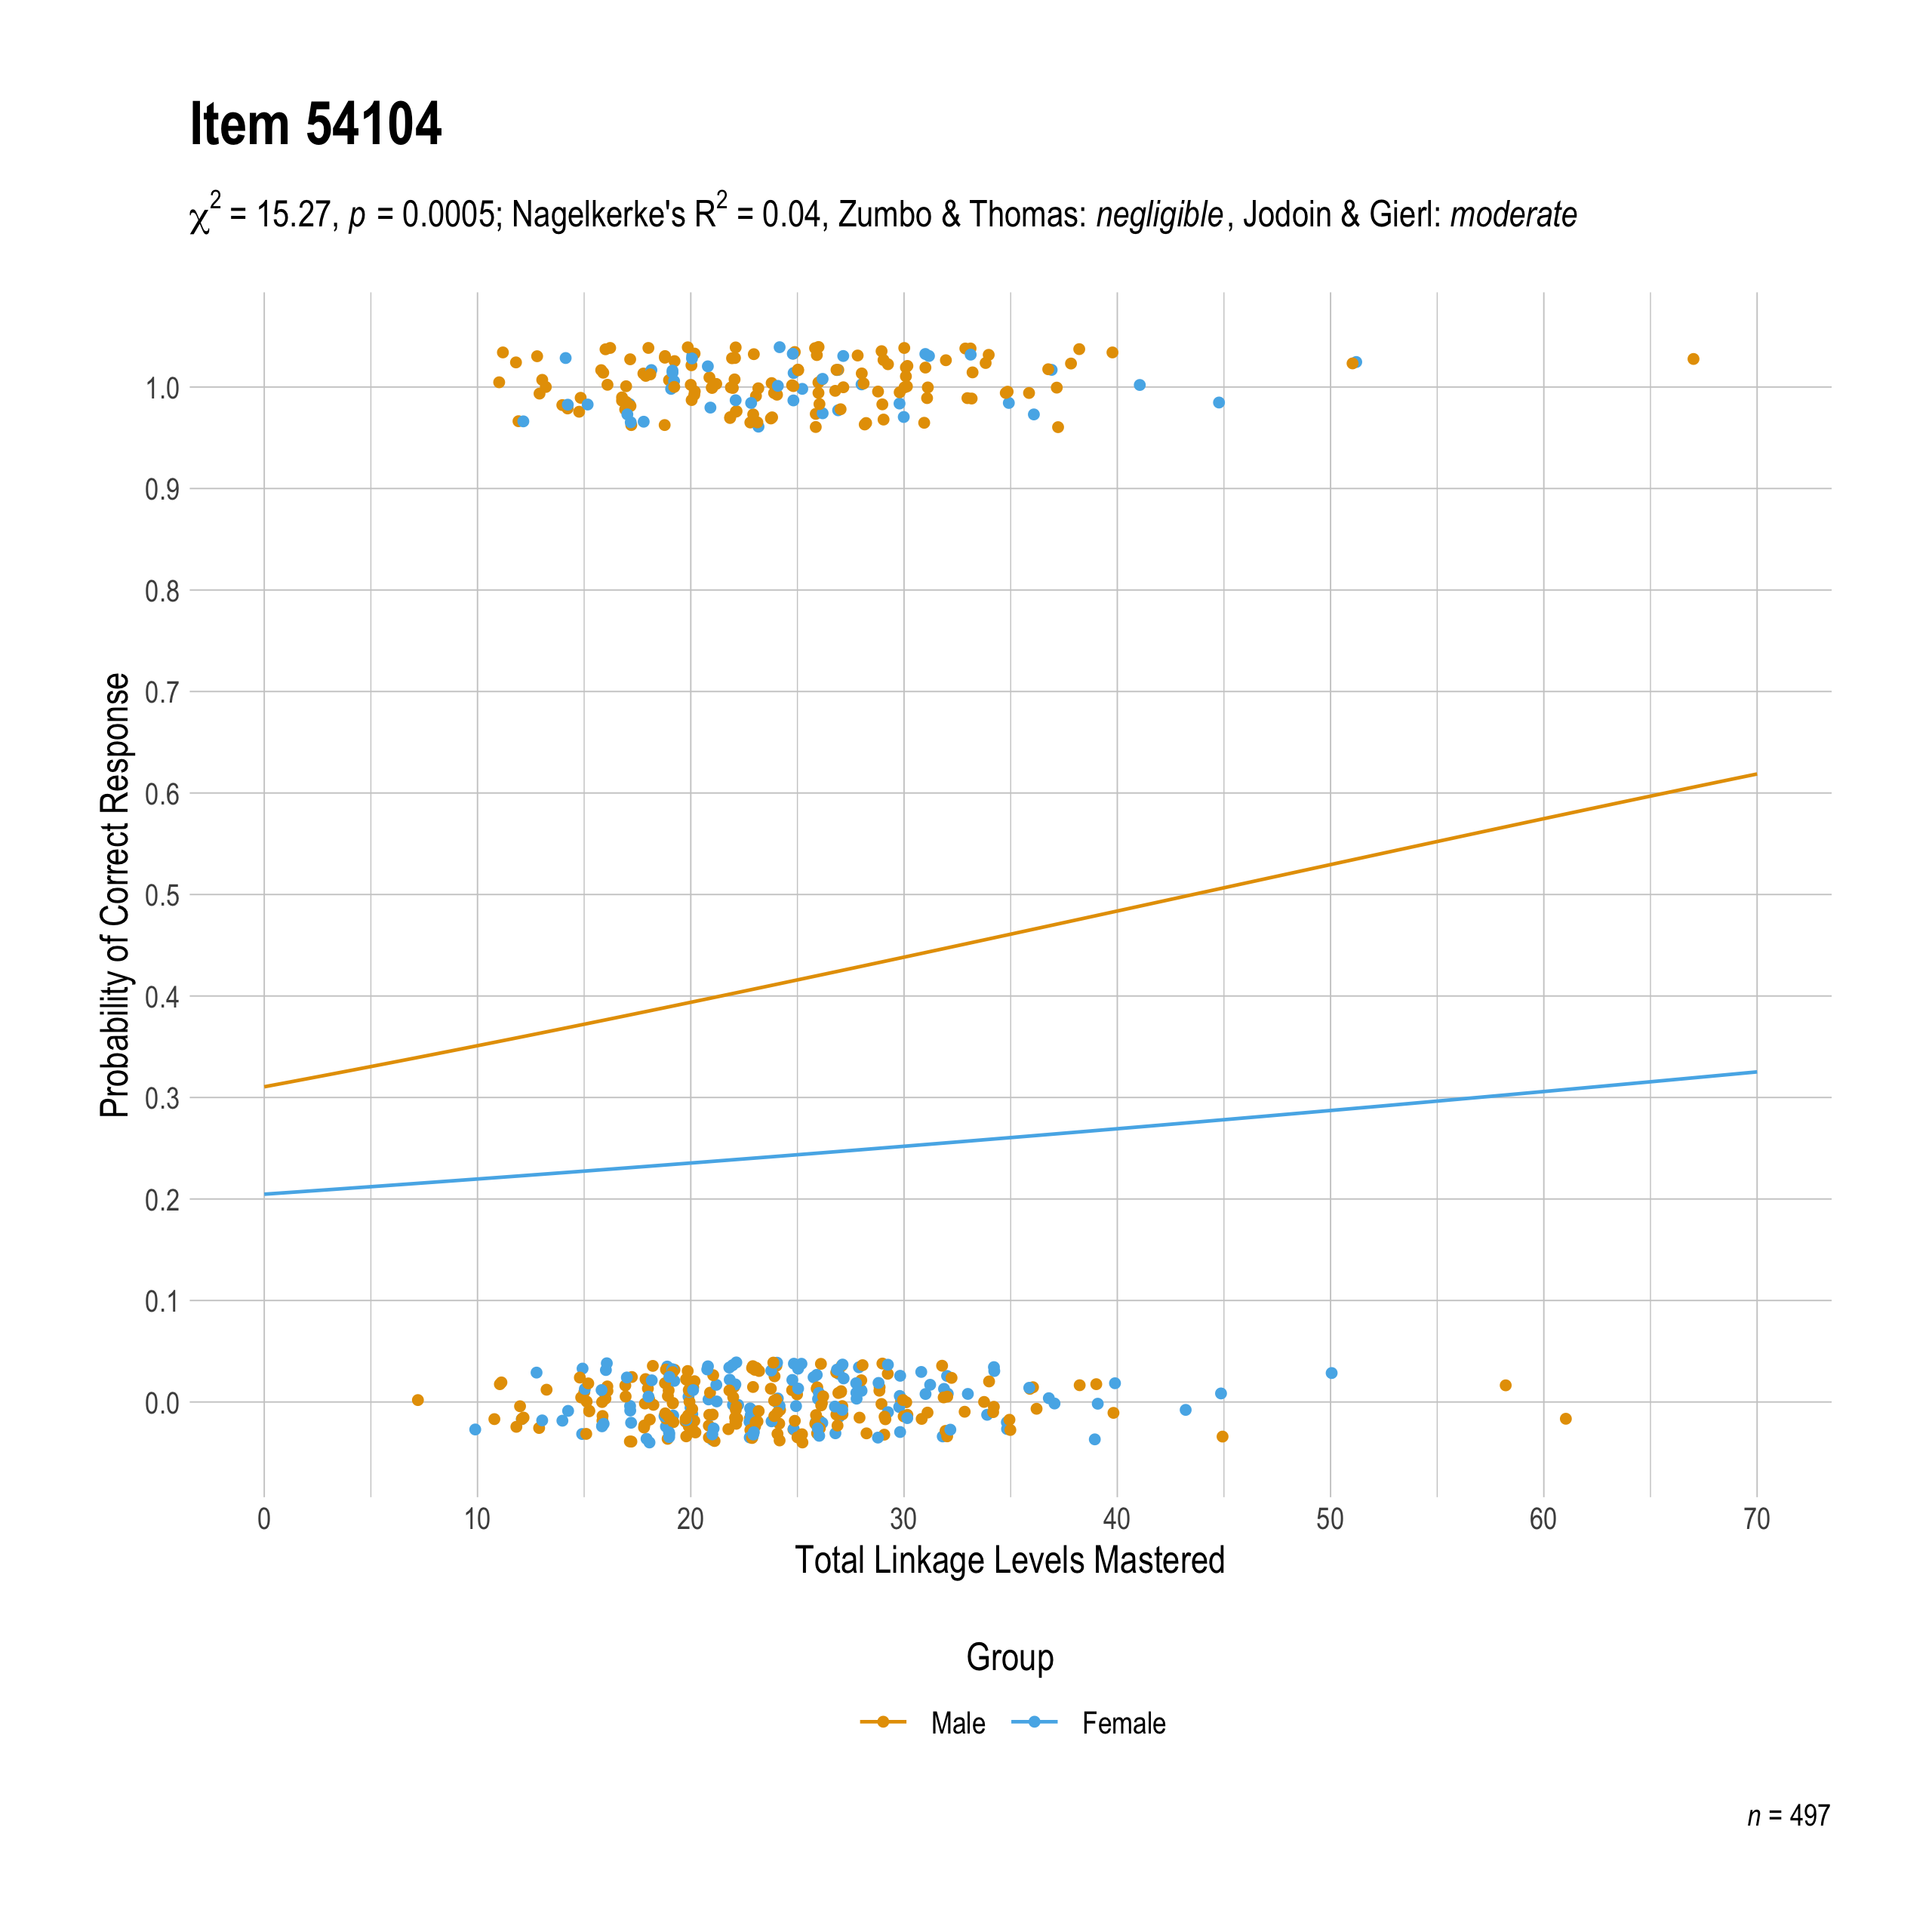
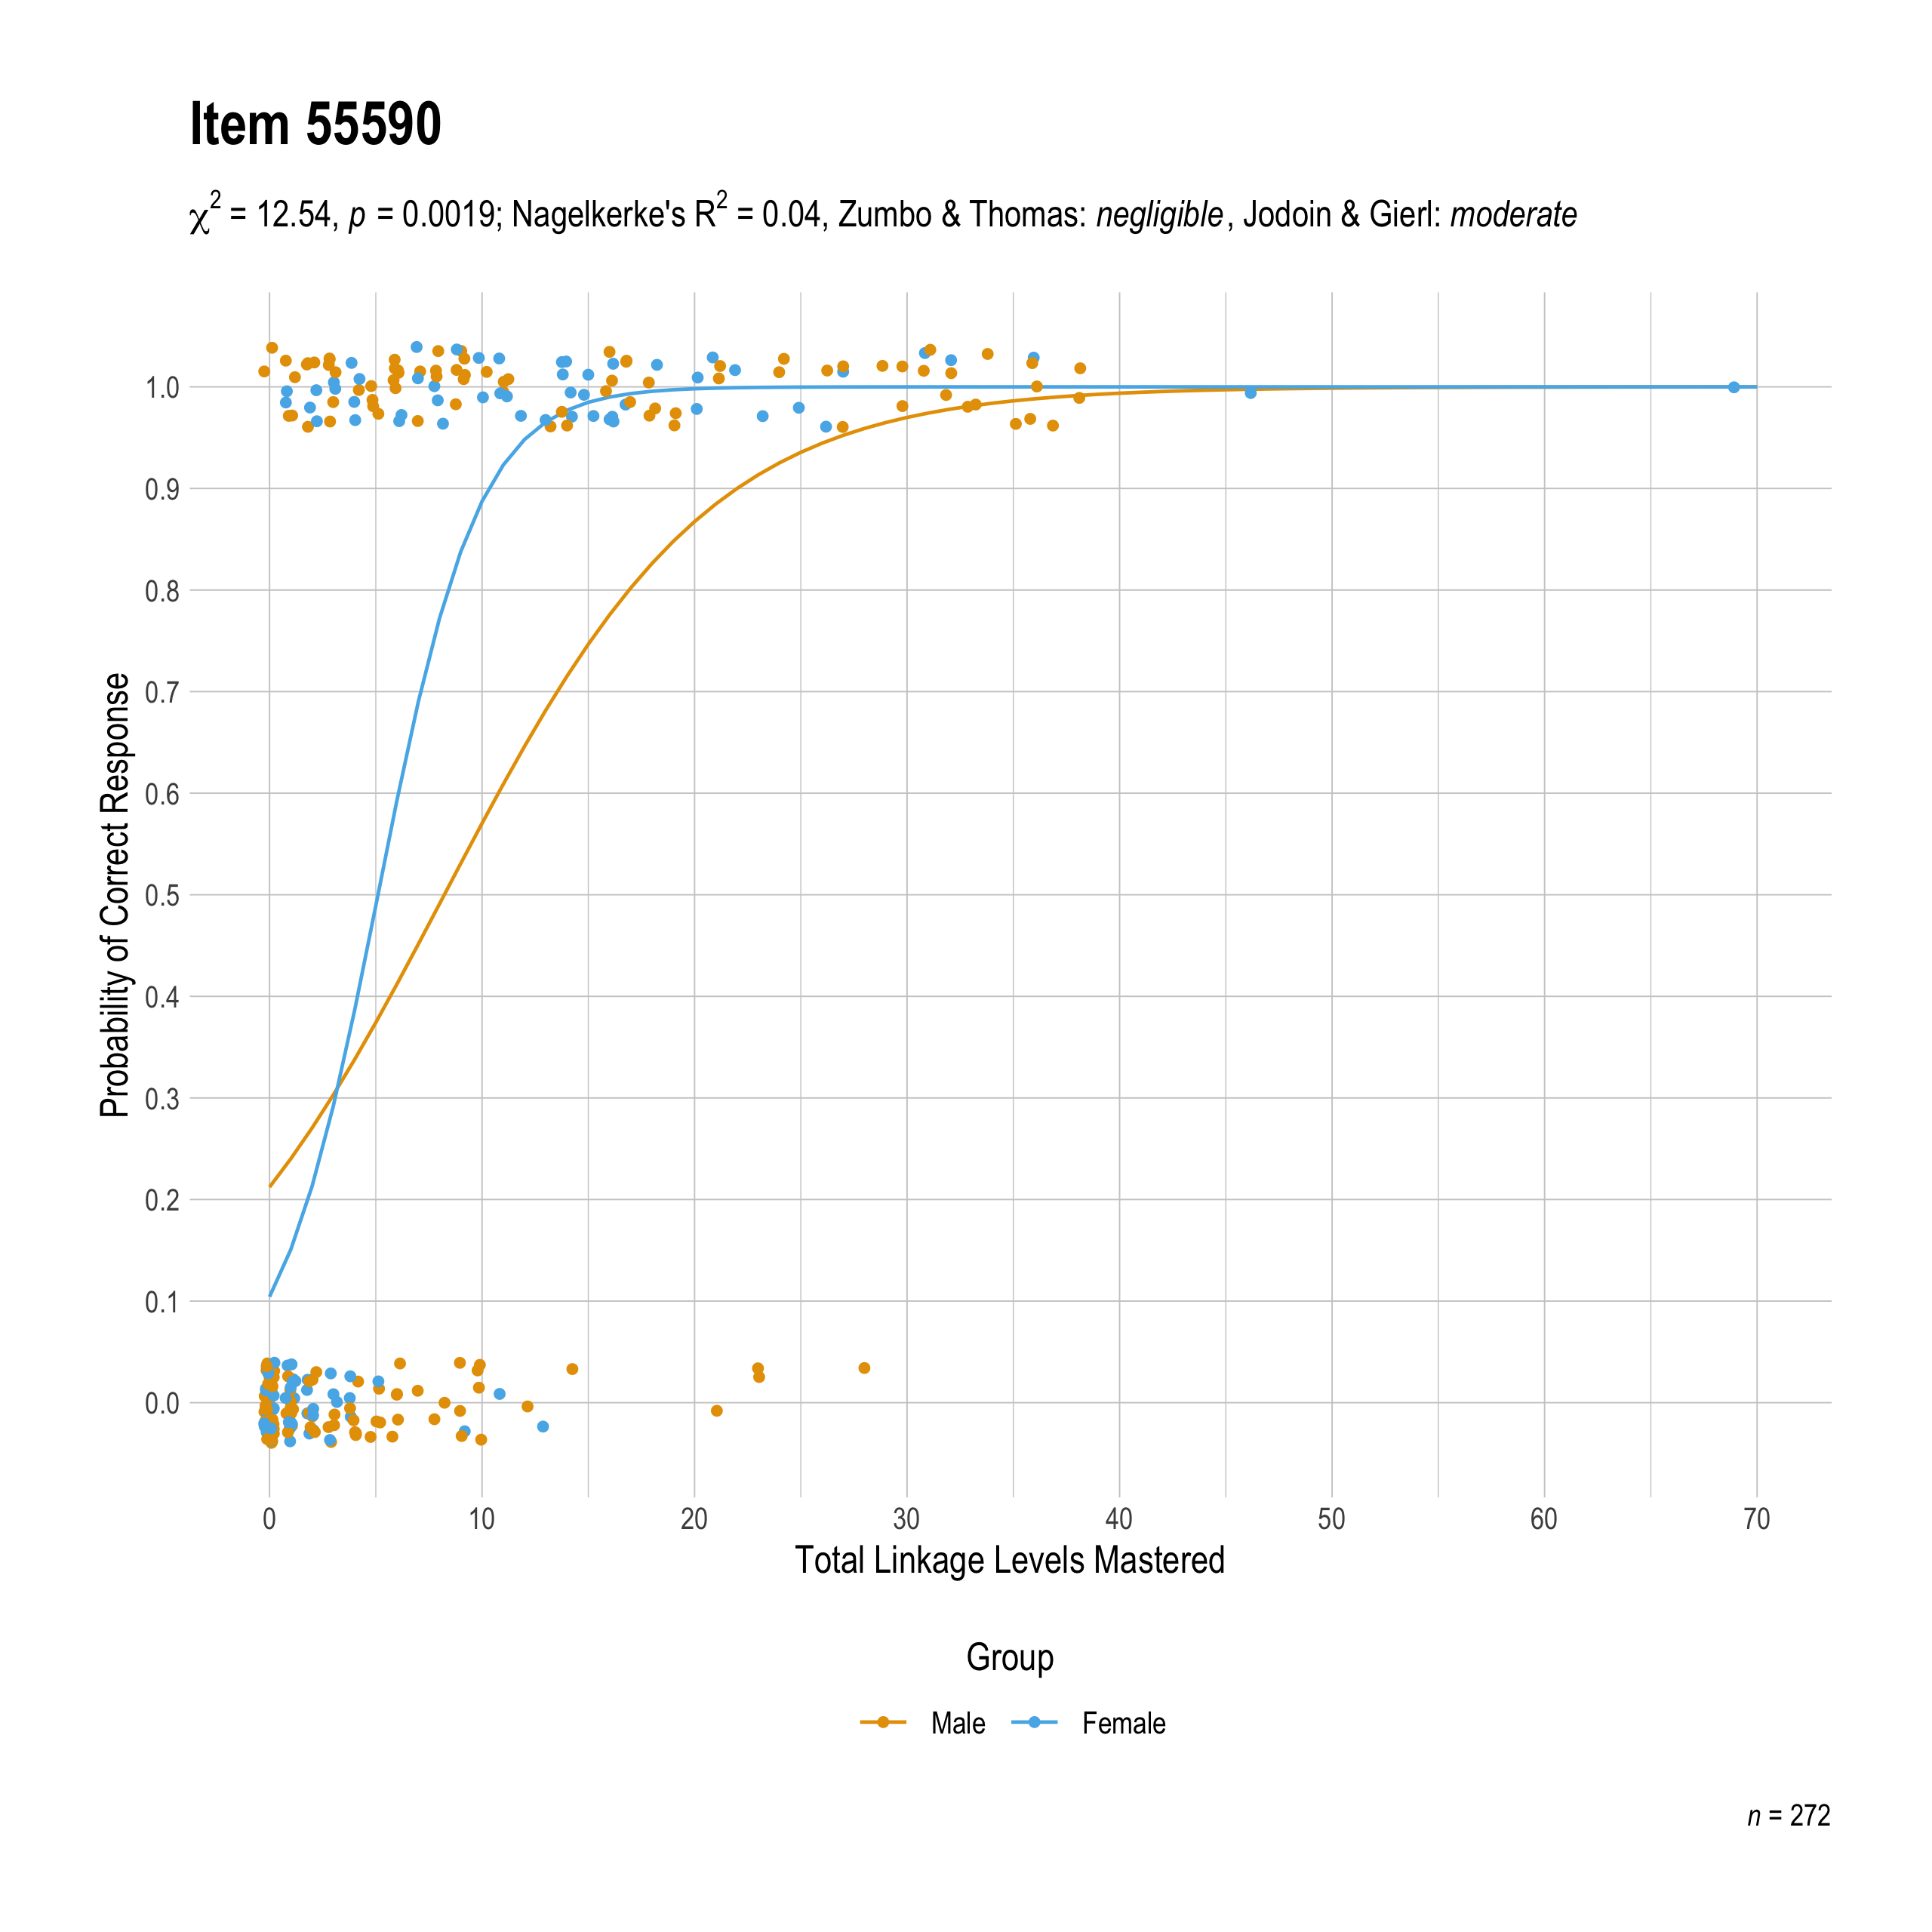
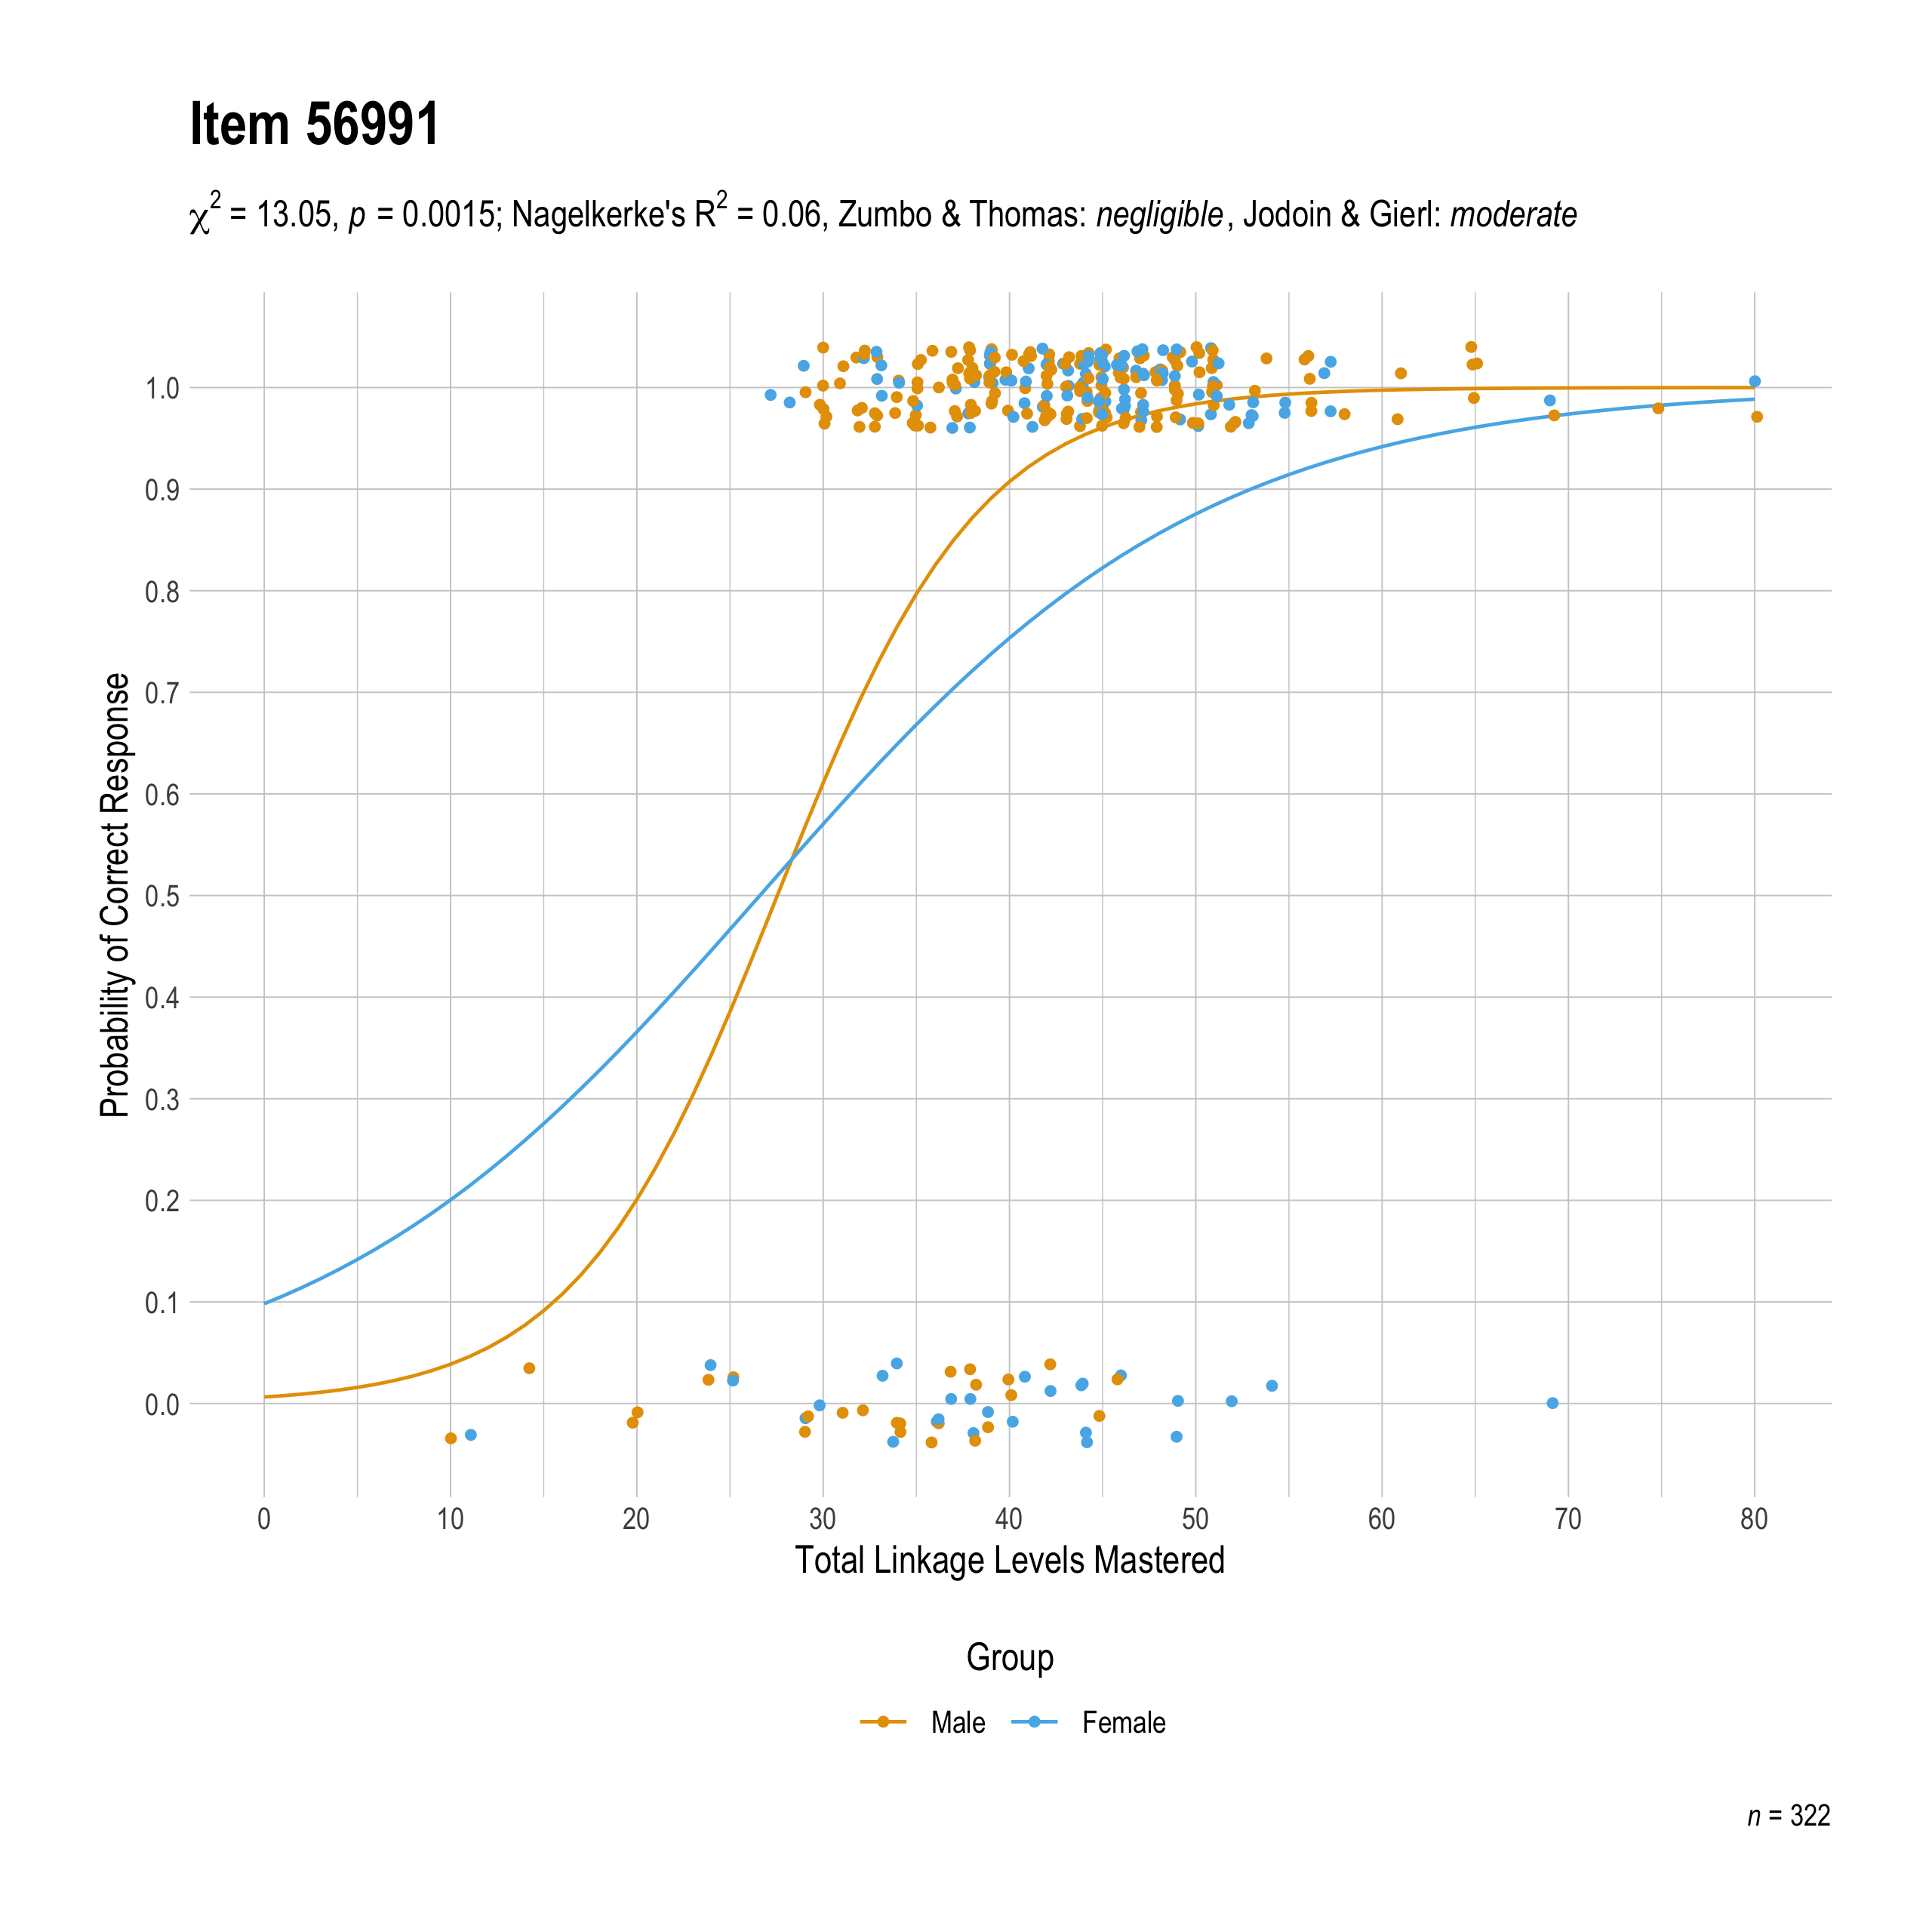
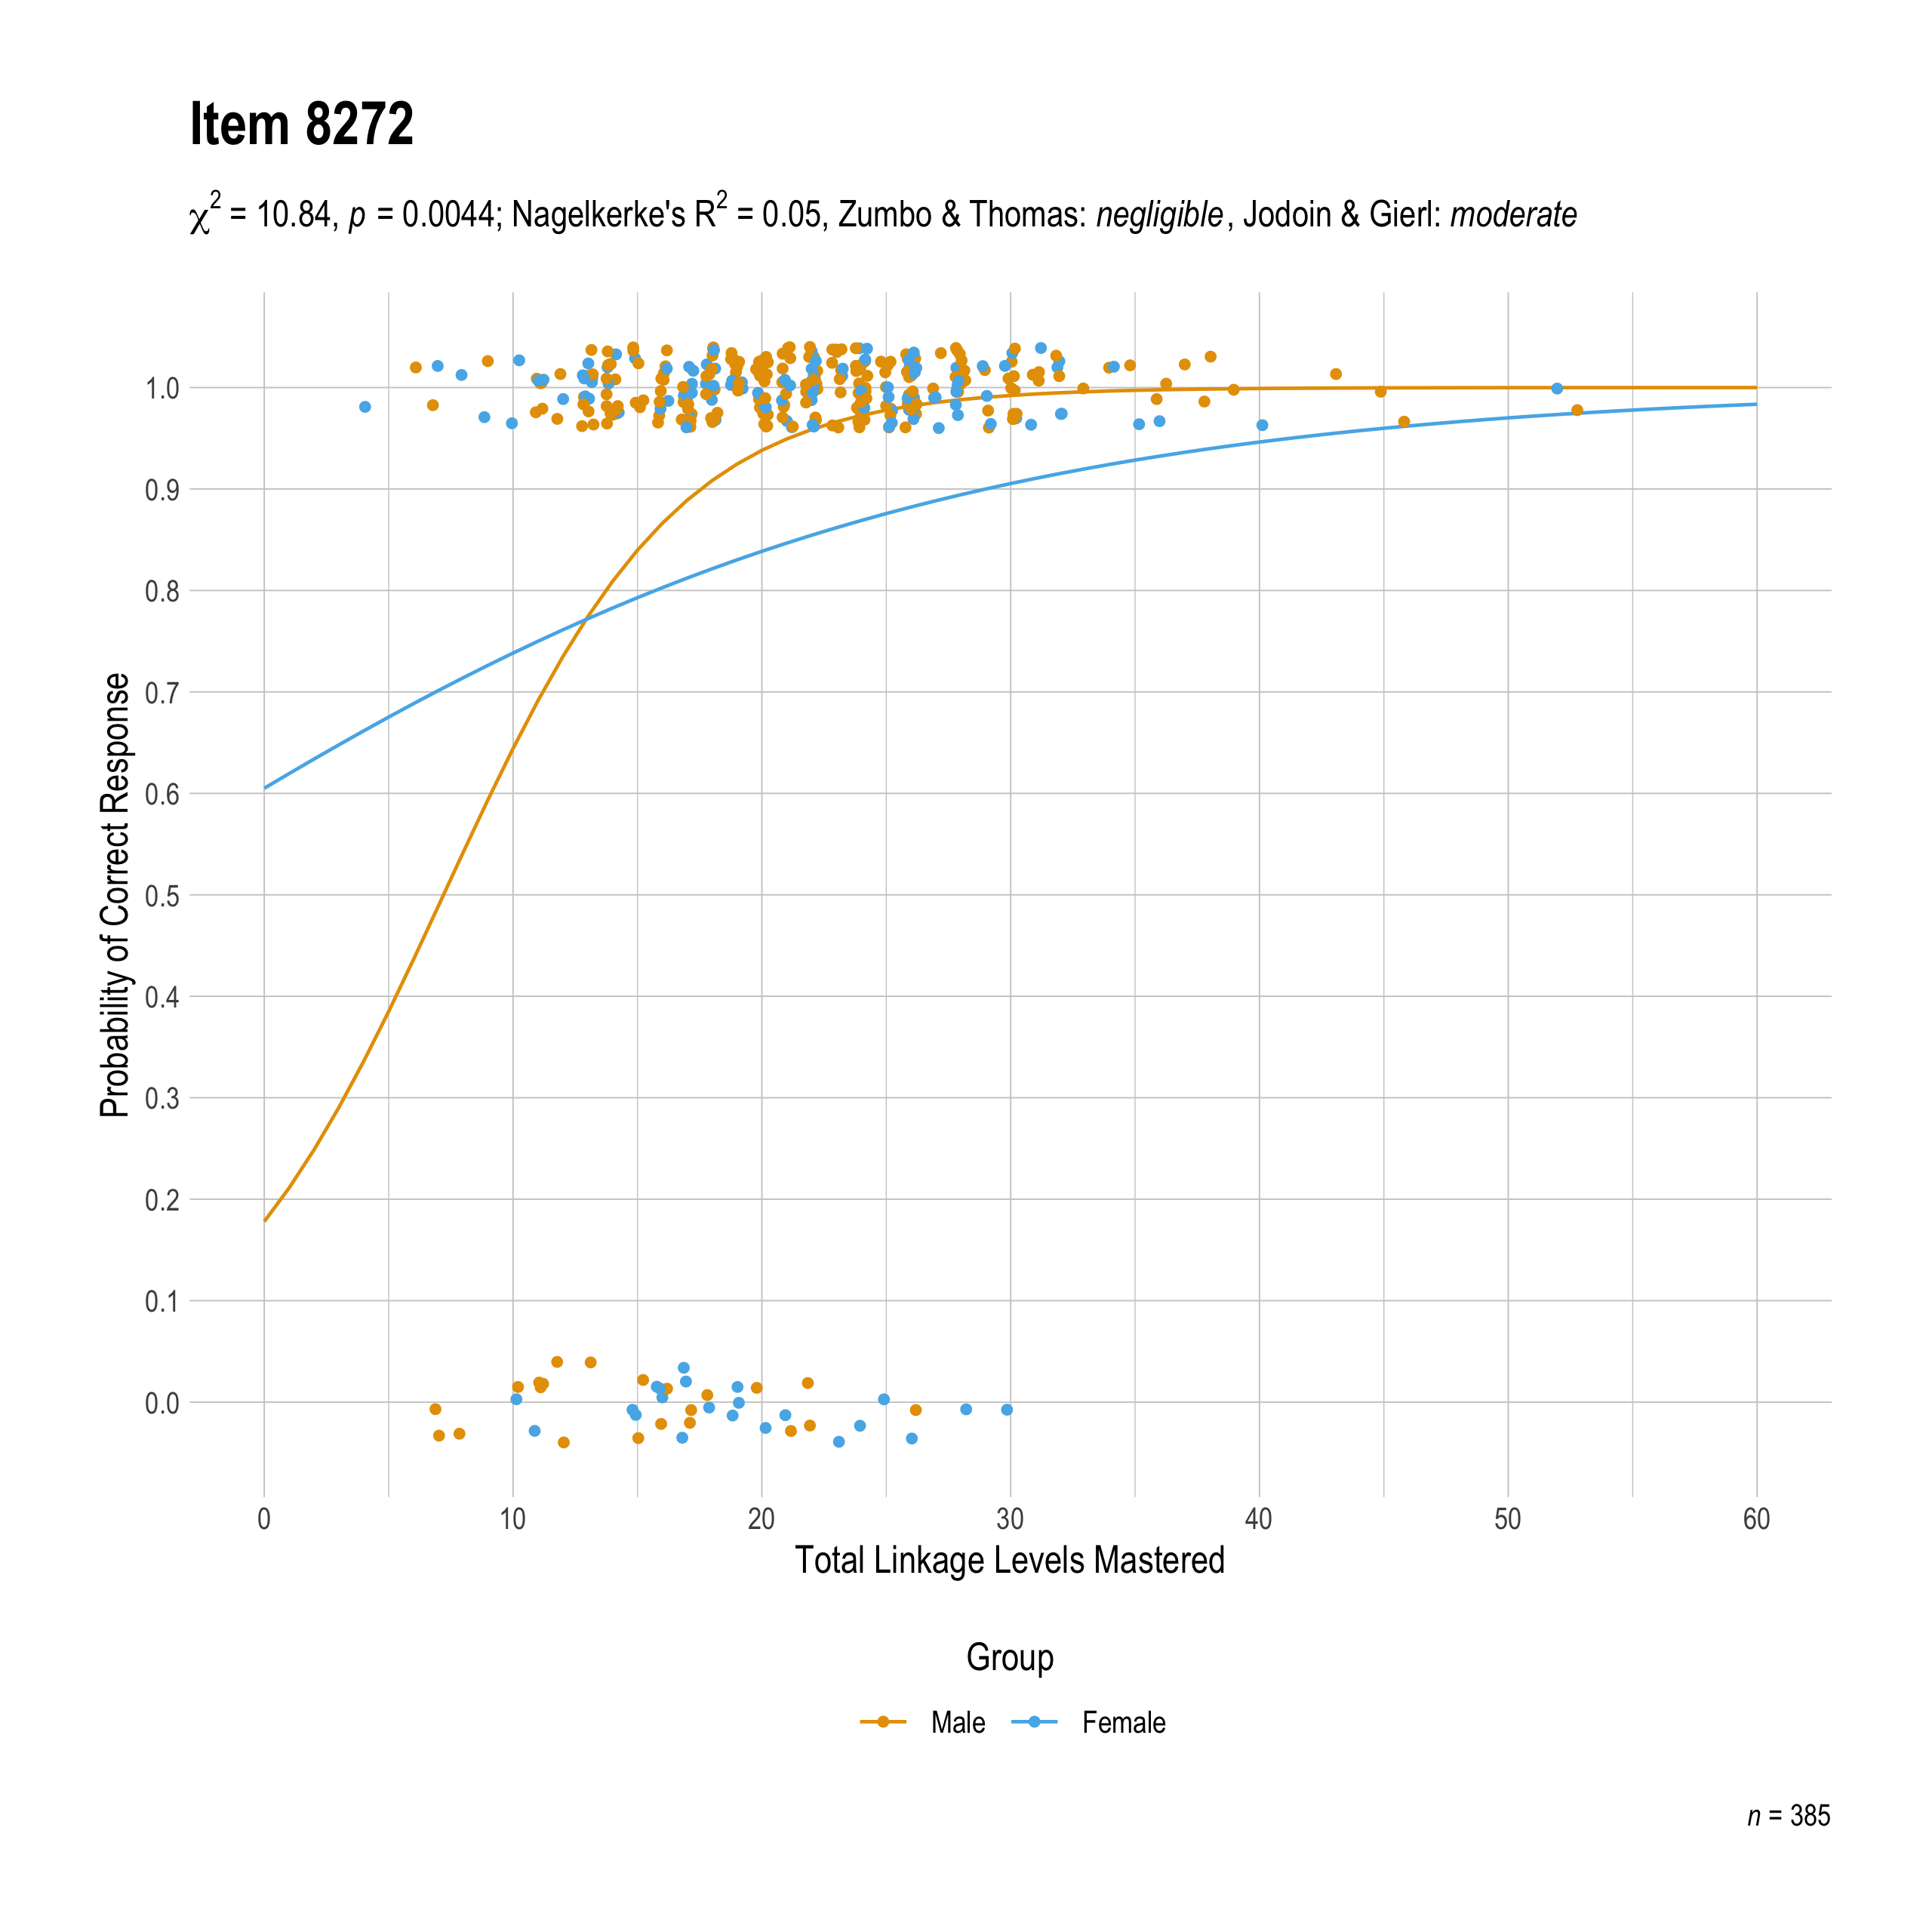
B Differential Item Functioning Plots
The plots in this section display the best-fitting regression line for each gender group, with jittered plots representing the total linkage levels mastered for individuals in each gender group. Plots are labeled with the item ID, and only items with non-negligible effect-size changes are included. The results from the uniform and combined logistic regression models are presented separately. For a full description of the analysis, see the Evaluation of Item-Level Bias section.